

Qatar’s roads now carry 1.4 million active vehicles, and the newest are changing fast: Chinese brands make up 38% of 2025 models. Here is what official data show for dealers, fleets and suppliers.
Qatar’s car market is growing, and the mix of brands on its roads is changing faster than at any time in the past decade. The Ministry of Interior’s vehicle register counted 1,397,202 active vehicles on September 30, 2026. Among the newest of them, Chinese brands account for 38.0% of the 2025 models among cars and commercial vehicles, up from 1.6% of the 2016 models, while Japanese brands moved from 66.3% to 40.9% (Exhibit 1). Toyota still leads with 23.6%, and Jetour, whose first vehicles on the register are 2023 models, is now second with 13.8%.1 Imports tell the same story of growth: Qatar brought in QAR 12.7 billion of passenger cars in 2025, against QAR 5.0 billion in 2023.2
For distributors, fleet operators, financiers, insurers, and aftersales suppliers, these shifts change what to stock, how to price risk, and where service capacity is needed. This article sets out what the official registers and trade statistics show about the size of the fleet, the brands buyers in Qatar are choosing, and the imports behind them, and what each means for companies in the sector.
Exhibit 1
Chinese brands went from 1.6% of the 2016 models to 38.0% of the 2025 models, as the total grew by 10,133 vehicles.
Active cars and commercial vehicles by brand origin, Qatar, 2016 and 2025 models, number of vehicles; change in share, points; share of 2025 models, %
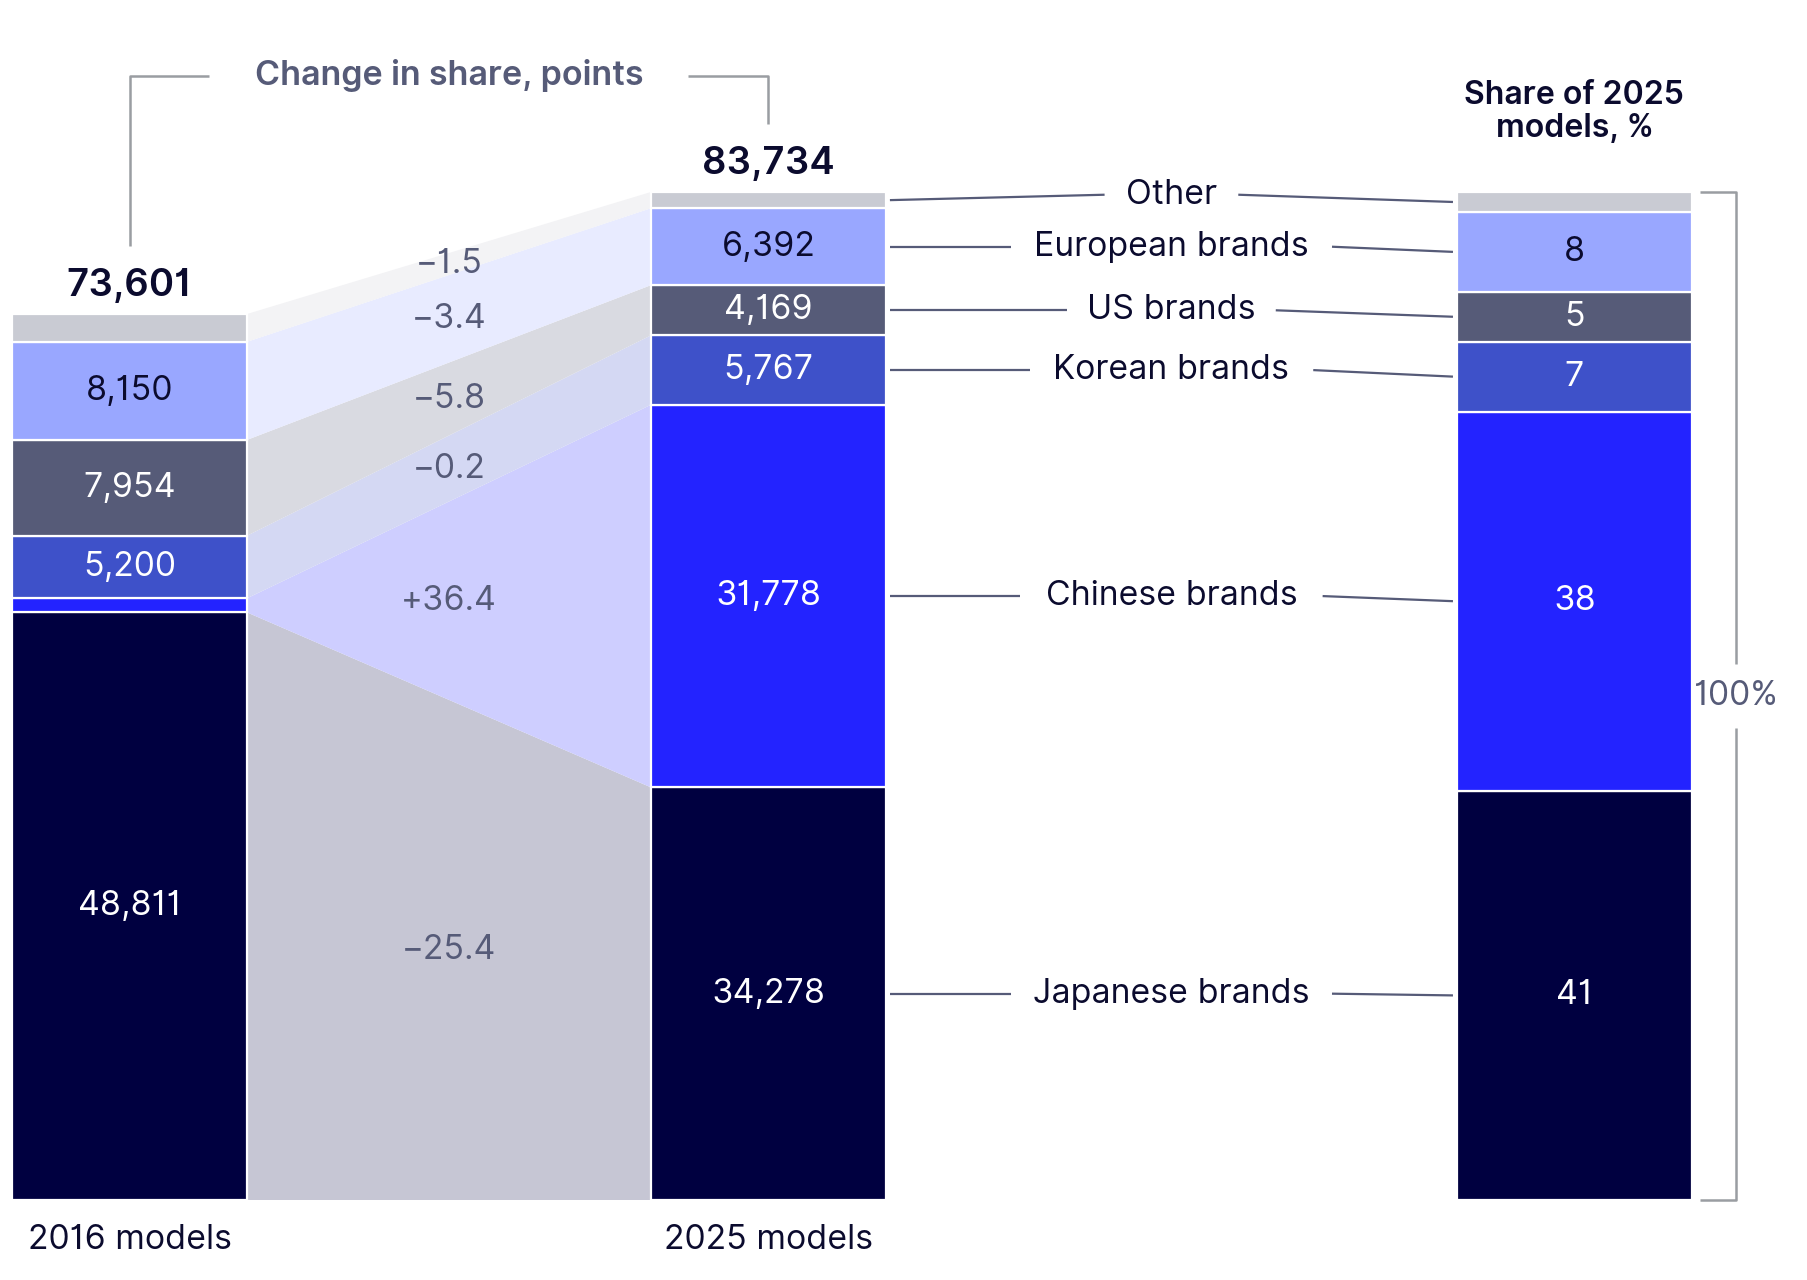
Note: Active vehicles with private and private-transport plates on the Ministry of Interior register on September 30, 2026. Brand origin is the brand’s home market; MG, owned by SAIC Motor, is counted as Chinese. Other includes Indian brands and the 0.4% of vehicles whose brand could not be classified. Shares of 2025 models are rounded to whole numbers; changes in share are calculated before rounding.
Source: Ministry of Interior, General Administration of Traffic, vehicle register (open data), September 30, 2026; Reeve Hayward analysis
A larger, busier market
Of the 1.4 million active vehicles on the register, 959,777 belong to individuals and 437,424 to companies. Private plates account for 939,159 vehicles and private-transport plates, which cover commercial vehicles, for 308,795.1 New registrations recorded by the National Planning Council (NPC) rose from 65,680 in 2019 to 94,822 in 2022 and were about 83,000 in 2023. The NPC’s latest monthly figures, for January to August 2024, show 62,163 new vehicles, 13.7% more than in the same months of 2023.3
The number of drivers has grown with the fleet. The NPC recorded 112,809 new driving licences in 2022, against 97,853 in 2019, and the Ministry of Interior’s licence register held 1.32 million licences in September 2026.3, 1 Women hold 15.9% of them, and 19.5% of those first issued in 2025.1 The resale market is active: ownership transfers reached 367,743 in 2022, up from 262,673 in 2018.3 More traffic has come with safer roads. Deaths in traffic accidents fell from 222 in 2022 to 144 in 2025, a reduction of 35%, while domestic gasoline use rose from 41.3 thousand to 52.8 thousand barrels a day over the same period.4, 5
1.4 million
Active vehicles on the Ministry of Interior register on September 30, 2026
38%
Share of Chinese brands among the 2025 models of cars and commercial vehicles, up from 2% of the 2016 models
35%
Reduction in road traffic deaths between 2022 and 2025
The brand mix: Chinese makers now supply more than a third of the newest vehicles
For a decade, Japanese brands supplied about two-thirds of the new vehicles bought in Qatar: 68.3% of the 2015 models and 66.5% of the 2019 models. Chinese brands then rose in steps, to 13.3% of the 2021 models, 17.2% of the 2024 models, and 38.0% of the 2025 models, while Japanese brands moved to 40.9% (Exhibit 1). Korean brands have held a steady 6% to 10% throughout. US and European brands each account for a smaller share of the newest vehicles than they did a decade ago, at 5.0% and 7.6% of the 2025 models.1
The change spans several brands. Among the 2025 models, Jetour holds 13.8%, MG 3.7%, Geely 3.6%, Great Wall 2.7%, Chery 2.5%, and BYD 2.3%, alongside Toyota at 23.6%, Nissan at 4.4%, Mitsubishi and Lexus at 3.9% each, and Kia at 3.8% (Exhibit 2). Qatari buyers are part of the shift: of the 2025 models owned by Qatari individuals, 38.0% are Chinese brands and 42.1% Japanese. Women own 27.1% of the 2025 models registered to individuals.1
Exhibit 2
Jetour went from its first 2023 models to 13.8% of the 2025 models, second only to Toyota.
Share of active cars and commercial vehicles by brand, Qatar, 2016–25 models, % of each year’s models
| Models | Toyota | Jetour | Nissan | Mitsubishi | MG | Geely |
|---|---|---|---|---|---|---|
| 2016 | 23.4 | 0.0 | 19.4 | 12.4 | 0.0 | 0.0 |
| 2017 | 28.3 | 0.0 | 11.1 | 11.6 | 0.0 | 0.0 |
| 2018 | 30.5 | 0.0 | 11.7 | 7.6 | 0.2 | 0.0 |
| 2019 | 31.1 | 0.0 | 15.8 | 6.3 | 1.2 | 0.0 |
| 2020 | 26.6 | 0.0 | 14.6 | 8.9 | 3.5 | 0.1 |
| 2021 | 30.4 | 0.0 | 7.5 | 6.8 | 3.0 | 0.9 |
| 2022 | 38.6 | 0.0 | 7.8 | 6.1 | 2.4 | 1.5 |
| 2023 | 27.3 | 0.3 | 8.2 | 4.7 | 3.1 | 2.2 |
| 2024 | 31.0 | 2.5 | 10.1 | 4.5 | 3.0 | 2.0 |
| 2025 | 23.6 | 13.8 | 4.4 | 3.9 | 3.7 | 3.6 |
Note: Active vehicles with private and private-transport plates on the Ministry of Interior register on September 30, 2026, grouped by the year of the model (between 31,098 and 83,734 vehicles for each year’s models). Six of the eight largest brands among 2025 models are shown; Lexus (3.9%) and Kia (3.8%) are left out for readability.
Source: Ministry of Interior, General Administration of Traffic, vehicle register (open data), September 30, 2026; Reeve Hayward analysis
Imports: more cars, from more places, with a first electrified wave
Trade statistics confirm the momentum. Passenger car imports were QAR 5.0 billion in 2023, QAR 8.1 billion in 2024, and QAR 12.7 billion in 2025. Part of that flow is re-exported, reaching QAR 3.9 billion in 2025, so cars retained in the country rose from QAR 3.6 billion in 2023 to QAR 8.8 billion in 2025, about two and a half times as much (Exhibit 3).2 The NPC’s vehicle trade totals agree with the Ministry of Commerce and Industry’s own series within 1.5% for 2019 to 2023.7
Exhibit 3
Car imports retained in Qatar have grown about two and a half times since 2023, to QAR 8.8 billion in 2025.
Imports of passenger cars (HS 8703), Qatar, gross and net of re-exports, 2019–25, QAR billion
| Year | Imports | Net of re-exports |
|---|---|---|
| 2019 | 4.0 | 3.2 |
| 2020 | 2.9 | 2.1 |
| 2021 | 4.1 | 2.9 |
| 2022 | 4.9 | 3.8 |
| 2023 | 5.0 | 3.6 |
| 2024 | 8.1 | 6.2 |
| 2025 | 12.7 | 8.8 |
Note: 2023 and 2025 are the sums of the four quarterly bulletins; other years are from the annual bulletins. Net of re-exports deducts passenger cars imported and then shipped out again. The NPC’s totals for all vehicles and parts (HS chapter 87) agree with the Ministry of Commerce and Industry’s series within 1.5% for 2019–23.
Source: National Planning Council, Foreign Merchandise Trade Statistics, annual bulletins 2019–22 and 2024 and quarterly bulletins 2023 and 2025, Tables 4 and 6; Ministry of Commerce and Industry; Reeve Hayward analysis
The origin of imports has broadened. In 2025, China supplied 29.1% of the value of Qatar’s car imports, up from 3.0% in 2019, and 45.8% of the cars imported: 52,003 of 113,463. Japan supplied 44.4% of the value and 30.5% of the cars, the United States 6.1% and 3.8%, and Germany 4.1% and 2.0% (Exhibit 4). China’s share of cars is higher than its share of value because cars from China averaged about QAR 71,000 in declared value in 2025, against about QAR 163,000 for cars from Japan.6
Exhibit 4
China supplied 45.8% of the cars Qatar imported in 2025, and Japan 44.4% of their value.
Imports of passenger cars (HS 8703) by country of origin, Qatar, 2025, share of import value, %; number of cars
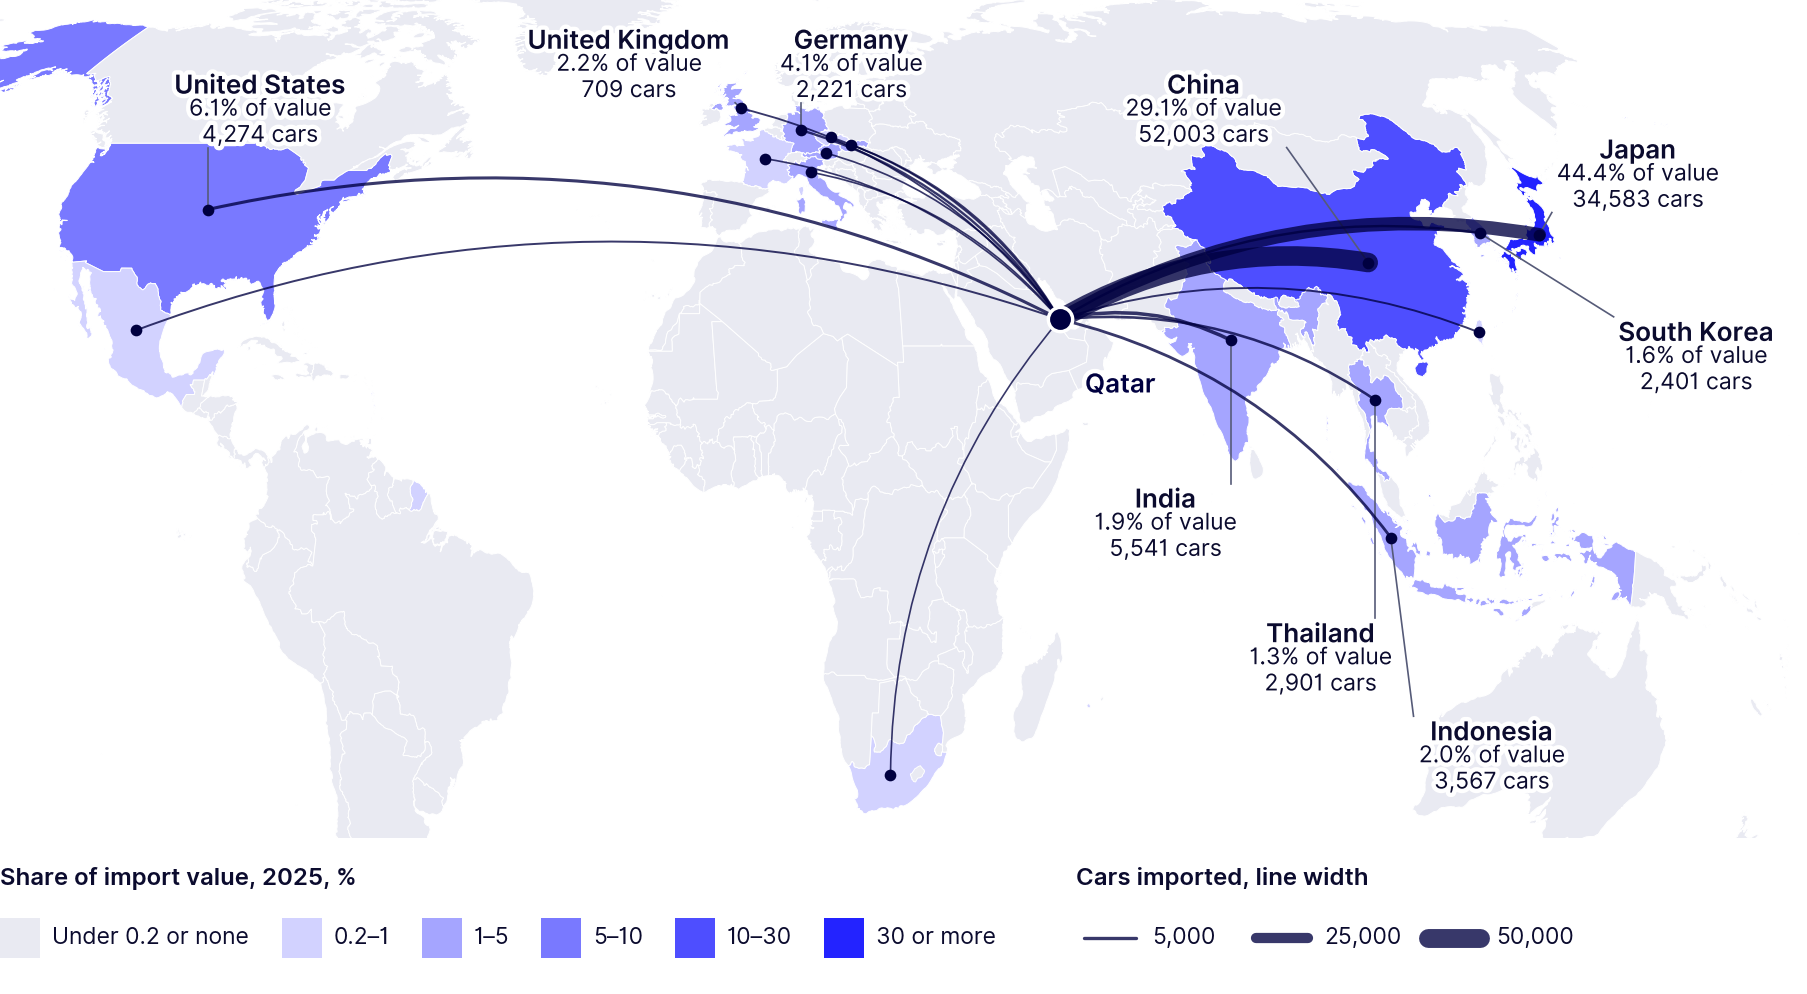
Note: Country of origin is where a car was made, not the brand’s home market; Japanese brands, for example, also reach Qatar from Thailand, India, and Indonesia. Counts include cars later re-exported. Lines are drawn for the 17 origins with at least 0.2% of import value; the other 19 origins together supplied 0.7% of the value and 680 cars. Country outlines: Natural Earth.
Source: National Planning Council, Qatar Imports 2025–2026, Qatar Open Data, updated October 19, 2026; Reeve Hayward analysis
Electrified cars are arriving from a low base. Cars declared at customs as hybrid or electric made up 1.0% of the value of passenger car imports in 2023, 3.3% in 2024, and 6.4% in 2025. Plug-in hybrids accounted for most of the growth, at QAR 591 million in 2025, with battery-electric cars at QAR 197 million.2 Imports of parts and accessories were QAR 635 million in 2025, a market that grows with every new brand on the road.2
What this means for companies in the sector
A market that changes its brand mix this quickly rewards companies that plan from the registers rather than from impressions. This is the kind of market evidence we bring to strategy consulting in Qatar.
- Distributors: plan portfolios around the newest models. Four of the ten leading brands among the 2025 models were not in the top ten of the 2016 models. Brand portfolios, showroom space, and stock should follow the mix of the newest vehicles, which the register makes visible.
- Aftersales and parts: build capacity for the newer brands. Thousands of vehicles from brands with a short history in Qatar are likely to reach their first major services and repairs over the next few years. Parts stock, trained technicians, and warranty agreements take time to put in place.
- Fleet and rental operators: match fleets to the market. Companies own 437,424 active vehicles. Fleet choices affect running costs, resale values, and what customers expect to drive, and the register allows each operator to benchmark its own fleet against the market.
- Financiers and insurers: price new brands on evidence. Residual values and repair costs for brands with few years on Qatari roads are still forming. Underwriting and lending terms can draw on the register’s data on vehicle age, brand, and ownership as that history builds.
- Traders: use the resale and re-export channels. With 367,743 ownership transfers in 2022 and QAR 3.9 billion of passenger cars re-exported in 2025, Qatar is an active used-car market and a trading point for re-exports. Sourcing, reconditioning, and export services are part of the same opportunity.
A market that changes its brand mix this quickly rewards companies that plan from the registers rather than from impressions.
Qatar’s vehicle market combines a growing fleet, rising imports, safer roads, and buyers who are open to new brands. The official data now let companies see these changes as they happen, one year’s models at a time. Those that read them closely, and adjust their brands, service networks, and pricing accordingly, are likely to be best placed as the market continues to grow.
About this article
This article is based on official data downloaded on October 22 and 23, 2026: the Ministry of Interior’s vehicle and driving-licence registers, updated September 30, 2026; National Planning Council statistics on vehicle registrations, driving licences, foreign trade, including imports by country of origin, and road safety; and QatarEnergy fuel consumption data. Brand-origin shares are our analysis of the register. It is for information only and is not investment advice.
Sources
- Ministry of Interior, General Administration of Traffic, open data: vehicle register and driving-licence register (Vehicle.csv and License.csv), updated September 30, 2026.
- National Planning Council, Annual Bulletin of Foreign Merchandise Trade Statistics, 2019–2022 and 2024, and Quarterly Bulletins of Foreign Merchandise Trade Statistics, 2023 and 2025, Tables 4 and 6.
- National Planning Council, registered new vehicles, vehicle registration transactions, and driving licences issued, 2011–2022, Qatar Open Data portal; and “Qatar; Monthly Statistics,” bulletins for January 2023 to August 2024.
- National Planning Council, Judicial and Security Services statistics 2025, Tables 137 and 140, October 19, 2026.
- QatarEnergy, “Qatar Consumption of Gas, Gasoline, Diesel and Jet Fuel,” 2020–2025, Qatar Open Data portal.
- National Planning Council, “Qatar Imports 2019–2024” and “Qatar Imports 2025–2026,” imports by Harmonized System code and country of origin, Qatar Open Data portal, updated October 19, 2026; motor cars (HS 8703).
- Ministry of Commerce and Industry, “Trade Data for Vehicles and Parts (Non-Rail),” 2019–2023, Qatar Open Data portal.
To discuss what this means for your business, speak with our team. Initial conversations are confidential and without obligation.
Speak with our team


