

Little grain passes the Strait of Hormuz, but a third of the world's traded urea does. This report traces what the 2026 disruption did to fertilizer, food and freight, and what the alternatives cost.
The Strait of Hormuz is a fertilizer chokepoint before it is a food chokepoint. In the week before shipping through the strait was disrupted on 28 February 2026, it carried 38% of the world’s seaborne crude oil and 19% of its liquefied natural gas (LNG), but only 3% of container trade and 2% of dry bulk, the category that includes grain.1 About a third of the world’s seaborne fertilizer trade, some 16 million tonnes a year, passed through the same narrow strait, two-thirds of it urea.2 Iran, Qatar, Saudi Arabia, the United Arab Emirates (UAE) and Bahrain together supplied 34% of world urea trade in 2024, 23% of ammonia, 18% of the main phosphate fertilizers and 49% of sulfur, the input from which phosphate fertilizer is made.3
Eight months on, the shock has run through fertilizer and freight far more than through food itself. The Middle East urea price rose from $472 a tonne in February to $857 in April, up 82% in two months, and had fallen back to $408 by September as buyers found other suppliers and some cargoes moved again.4 The phosphate fertilizer DAP did not fall back: it was $801 a tonne in September, 28% above February.5 The FAO Food Price Index reached 136.0 in September, 5.8% higher than a year earlier and its highest level since November 2022, with cereals up 17% on the year.6 The World Bank expects food commodity prices to rise 10% in 2026 and 7% in 2027, and the International Monetary Fund (IMF) assumes in its baseline that traffic through the strait resumes only in March 2027.7
The cost of a long disruption therefore lands in two places. The first is the farm. By the end of April 2026, 800,000 tonnes of urea sat on 17 ships west of the strait, and only about 85,000 tonnes had left the Gulf in two months; the IFA’s twelve-month scenario cuts world nitrogen use in 2026/27 by close to 4%, a fall it compares with 2008 and 2009.8 Less fertilizer applied in 2026 means smaller harvests in 2027, above all in the countries that bought most of their urea from the Gulf: India, Brazil, Australia, Thailand and much of East Africa (Exhibit 1). The second is the freight bill. War-risk insurance on a Hormuz transit, about 0.1% of a ship’s value before the hostilities, rose to 2% to 3% in March and, by one broker’s account, to between 3% and 10% by July; a container from China to Jeddah cost $10,870 in mid-September, 256% more than in February; and Maersk charges an emergency rate of $3,000 per 40-foot box for the upper Gulf plus $1,000 for any Hormuz transit.9
Exhibit 1
Fertilizer shipped through Hormuz in 2025 went mainly to India, Morocco, Indonesia, Brazil and Australia.
Fertilizer and sulfur shipped through the Strait of Hormuz, by product and destination, 2025, million tonnes
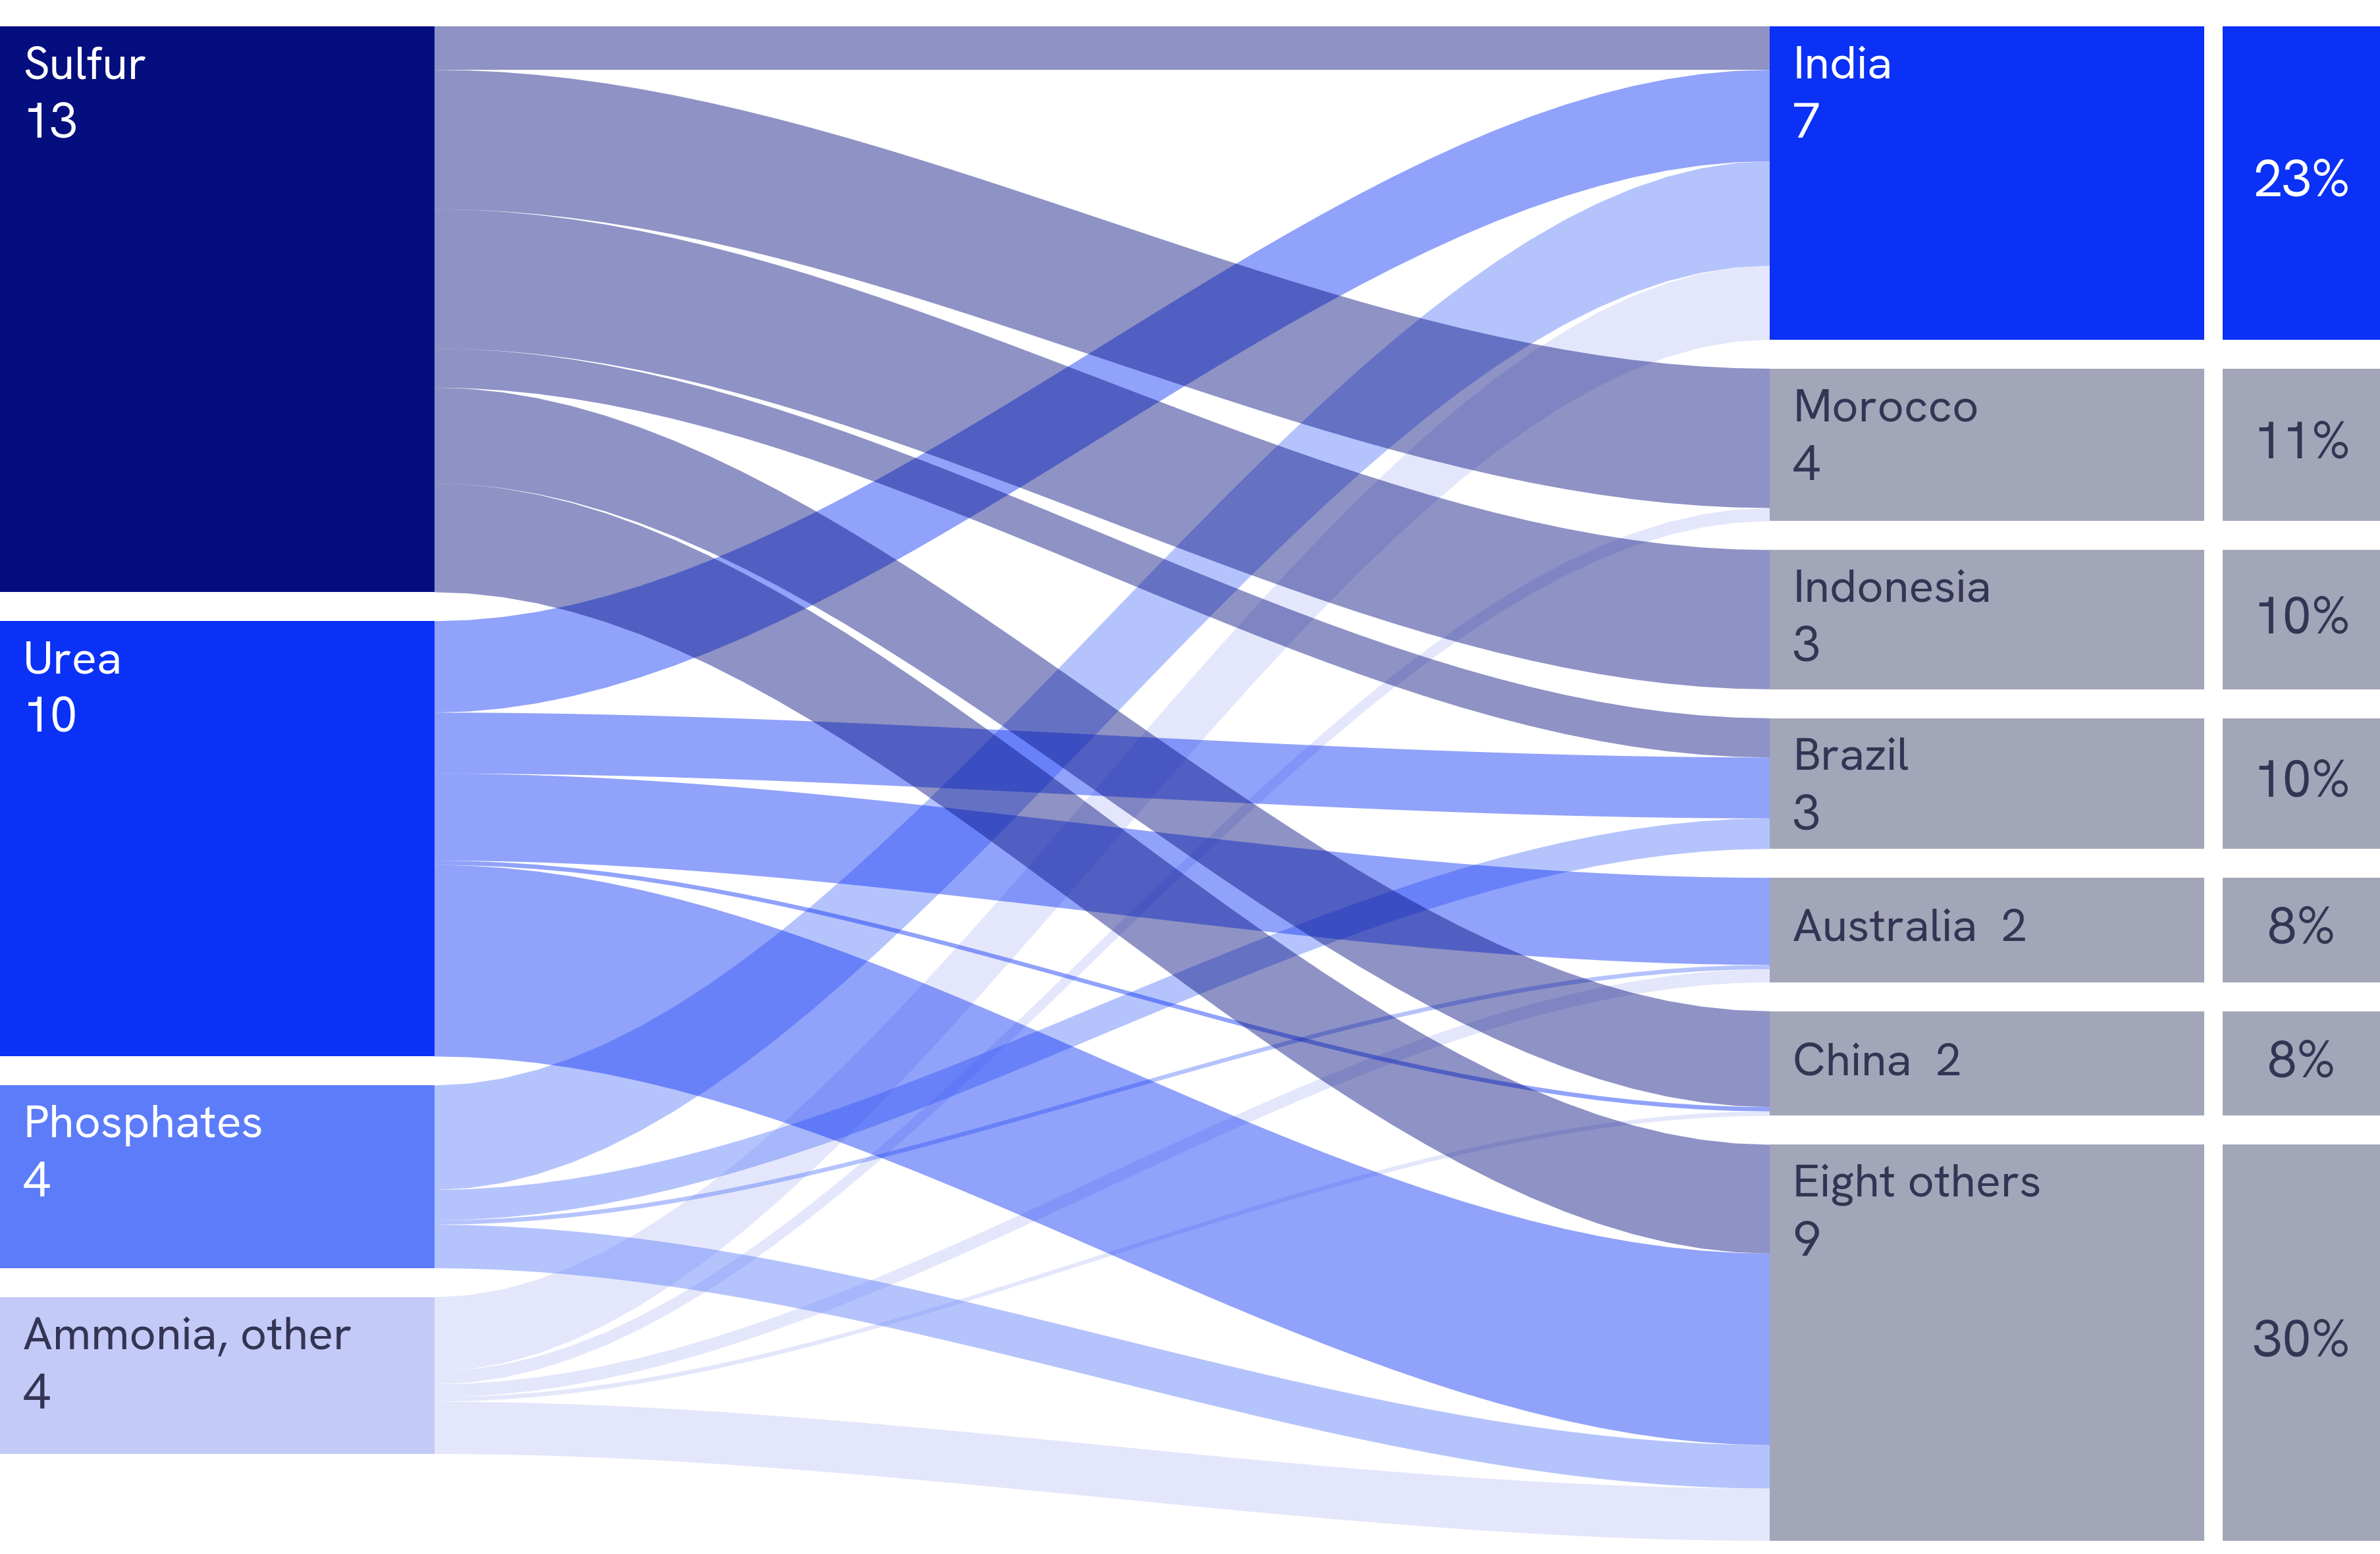
Note: 30.8 million tonnes in total, as labelled on the IFA chart. Phosphates combine DAP and MAP; “Eight others” are the United States, Thailand, Bangladesh, Tanzania, South Africa, Jordan, Djibouti and South Korea. Percentages are shares of the total.
Source: IFA, Medium-Term Fertilizer Outlook 2026–2030, May 2026 (AXS Marine, Signal Group data); Reeve Hayward analysis
For the Gulf’s own food, the picture is steadier than the headlines of March suggested. The Gulf states import between 70% and 90% of their food and entered the year with grain stocks equal to four to six months of normal use.10 Alternative routes exist, and they have been used: Oman’s ports handled 146 million tonnes of cargo in the first eight months of 2026, 62% more than a year earlier; Jeddah Islamic Port set a container record in July; Khor Fakkan on the UAE’s Indian Ocean coast went from 8,000 to 65,000 containers a week.11 Qatar’s own data show what preparation looks like: food imports rose 8% year on year in January and February, the strategic stock was reinforced and left untouched, and the ministry responsible reported that each of its air, sea and land routes could meet the country’s needs on its own.12
This report sets out what moves through the strait and what stopped; what the disruption did to fertilizer prices and supply; who depends on Gulf fertilizer; what has happened to food prices and to the Gulf’s own supply, with Qatar in detail; which alternative routes exist, what they carry and what they cost; and, drawing these together, what a long disruption costs against what the alternatives save. It describes published data; it does not forecast the conflict, value any company or recommend any security (see sidebar, “About the research”).
What moves through Hormuz, and what stopped
The strait matters for food through fertilizer and fuel, not through grain. Energy dominates its traffic: in late February 2026, 38% of seaborne crude, 29% of liquefied petroleum gas, 19% of LNG, 19% of refined products and 13% of chemicals passed through, against 3% of containers and 2% of dry bulk (Exhibit 2).13 By tonnage the strait carries 11% of world maritime trade, most of it oil and gas leaving the Gulf.14 A 2017 study for Chatham House put grain through Hormuz at 24 million tonnes a year, against 108 million through the Strait of Malacca.15 World cereal trade is about 506 million tonnes a year, so the strait carries a few percent of it, almost all of it inbound to the Gulf.16
Exhibit 2
Hormuz carries a third of seaborne fertilizer and most Gulf energy, but only 2% of dry bulk.
Share of global seaborne trade passing through the Strait of Hormuz, by cargo, late February 2026, %
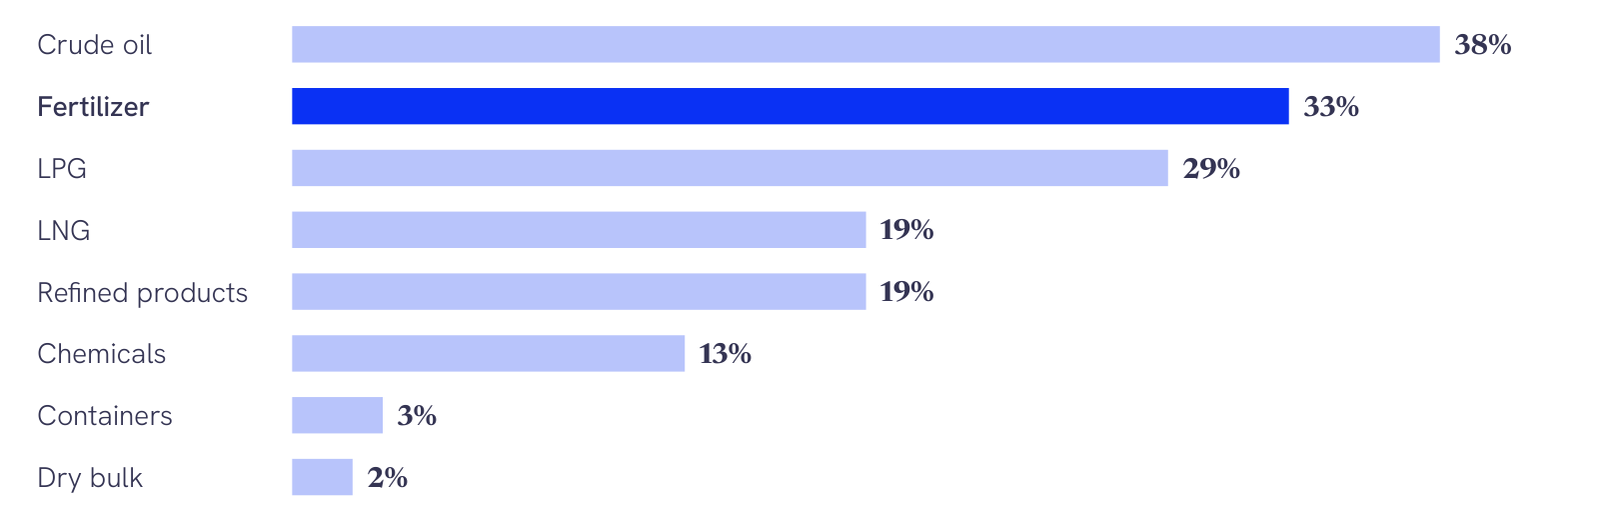
Note: Shares in the week before 28 February 2026, from Clarksons vessel tracking. Fertilizer is UNCTAD’s “about one-third” of seaborne fertilizer trade in 2024, shown as 33. Dry bulk includes grain.
Source: UNCTAD, Strait of Hormuz Disruptions: Implications for Global Trade and Development, March 2026; Reeve Hayward analysis
Fertilizer is the exception. The Gulf’s five main producers accounted for 34% of world urea trade, 23% of ammonia, 18% of DAP and MAP and 49% of sulfur in 2024; Oman, whose plants ship from outside the strait, is not in that count.17 Institutions put the urea share between a quarter and 36% depending on the year, the country group and whether they count exports or shipments through the strait; the IFA figures, which FAO repeats in its June 2026 Food Outlook, are the most fully documented.18 The reason is gas. Natural gas is 60% to 80% of the cost of making nitrogen fertilizer, and the Gulf has it cheaply and in volume: Saudi Arabia, Iran, Qatar and Oman made 15 million tonnes of ammonia nitrogen in 2025, 9% of world output, and the five Gulf sulfur producers 20 million tonnes, 24% of the world’s.19 Qatar’s QAFCO is the world’s largest single-site producer of ammonia and urea: it made 5.82 million tonnes of urea in 2024 and exported a record 5.69 million tonnes.20
Then the traffic stopped. The IMF’s PortWatch tracker counted 85 transits a day through Hormuz in 2025 and 79 a day in the first 27 days of February 2026. From March 1 to October 25 it counted 1,482, against 22,622 in the same days of 2025, a fall of 93%; the daily average has not exceeded 13 in any month since, and was 3.5 in October (Exhibit 3).21 UNCTAD, using a broader count, reported a fall from 129 ships a day to six.22 The ships that kept moving were disproportionately the ones that carry food: from March to late October, tracked transits by tankers fell 96% and by container ships 97%, but by dry bulk carriers, which bring grain and feed into the Gulf, 86%.23 The WTO’s tracker of cargo discharged at Gulf ports tells the same story: its index of agricultural imports through the strait, which fell to 12 in May against a 2025 base of 100, had recovered to 57 in October, while its index of fertilizer exports has stayed below 3 since July.24 The human cost has been real: the International Maritime Organization counted at least 70 verified attacks on commercial ships and 19 seafarers killed by late August, with up to 400 ships and some 6,000 seafarers unable to leave the Gulf.25 For fertilizer the effect was immediate. Between late February and the end of April, two urea vessels carrying about 85,000 tonnes and four sulfur vessels carrying about 200,000 tonnes left the Gulf; 800,000 tonnes of urea, 400,000 tonnes of sulfur, 150,000 tonnes of phosphates and 60,000 tonnes of ammonia waited on 33 ships.26 FAO counted more than a million tonnes of urea loaded and unable to sail in May, and world fertilizer trade in January to April fell to 41 million tonnes from 58 million a year earlier.27
Exhibit 3
Transits through Hormuz have run at a small fraction of 2025 levels in every month since March.
Vessel transits through the Strait of Hormuz detected by transponder, average per day, 2025 and 2026 by month, transits a day
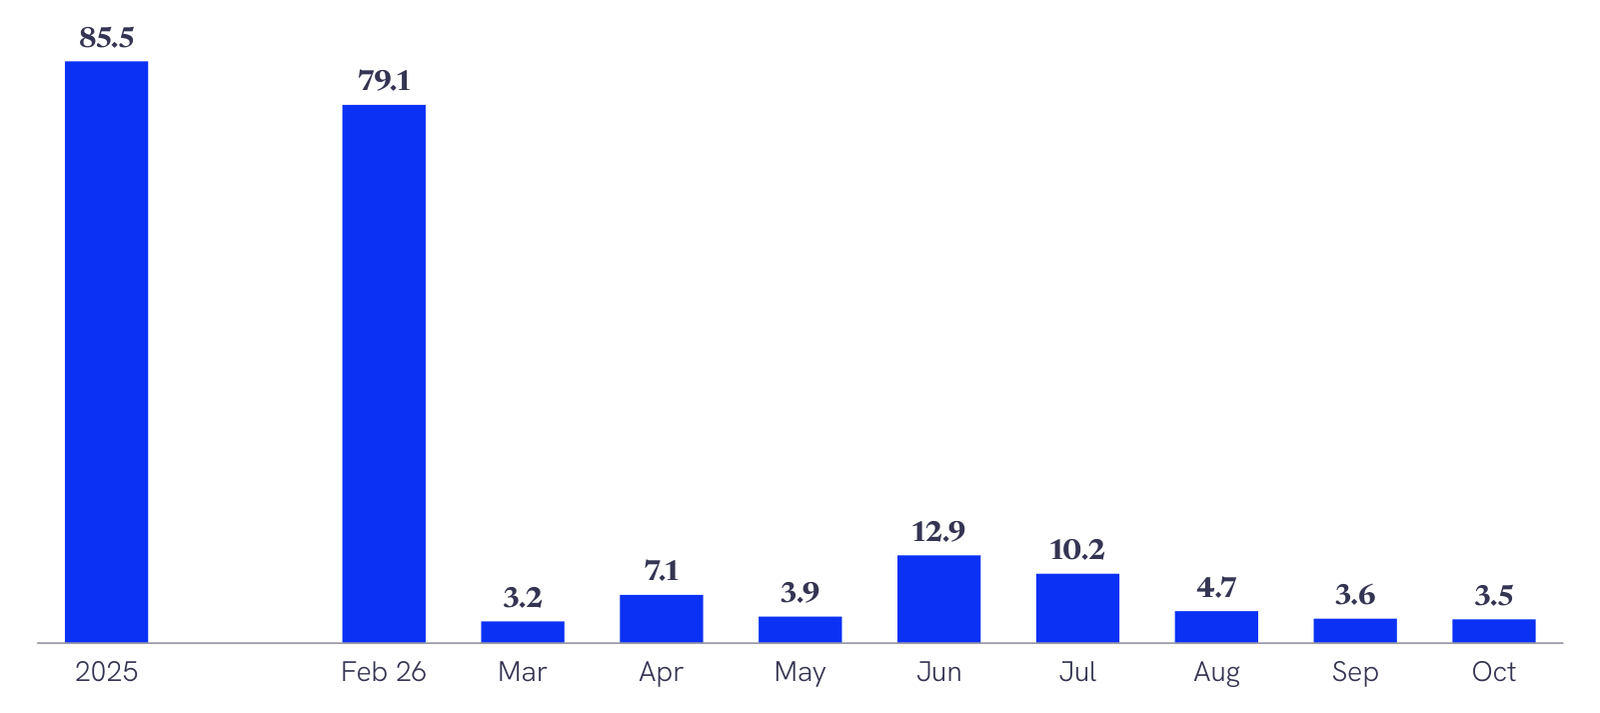
Note: All vessel types. 2025 is the full-year average; February 2026 covers the 1st to the 27th; October 2026 covers the 1st to the 25th. Ships sailing with transponders off are not counted.
Source: IMF PortWatch, Daily Chokepoints Data, downloaded October 30, 2026; Reeve Hayward analysis
The fertilizer shock: Prices doubled, then eased; supply has not fully returned
Fertilizer prices moved first and furthest. The World Bank’s fertilizer index rose 44% between February and April 2026, to 208.7, still 29% below its April 2022 peak, and then gave the whole gain back, falling 22% in the third quarter alone (Exhibit 4).28 Urea, the product most exposed to the strait, rose 82% from February to April and then fell 52% from April to September, ending 12% below its level of a year earlier as China lifted exports, other suppliers filled part of the gap and some Gulf cargoes moved again after the June memorandum.29 The World Bank expects China’s urea exports to reach 7.0 million tonnes in 2026, from 4.9 million in 2025.30
Exhibit 4
Urea doubled by April and gave it all back; phosphates and sulfur-linked products kept rising.
Change in monthly average prices, World Bank Pink Sheet, February to April 2026 and April to September 2026, %
| Product | Feb to Apr 2026 | Apr to Sep 2026 |
|---|---|---|
| Urea | 82 | -52 |
| DAP | 16 | 10 |
| TSP | 23 | 5 |
| Potassium chloride | 8 | -8 |
| Fertilizer index | 44 | -30 |
| Brent crude | 69 | -3 |
| Wheat, US HRW | 9 | 23 |
Note: Urea is prilled, f.o.b. Middle East; DAP and TSP are US Gulf; potassium chloride is Brazil c.f.r.; the fertilizer index is 2010 = 100. Brent crude and US hard red winter wheat for comparison.
Source: World Bank, Commodity Price Data (The Pink Sheet), October 2, 2026; Reeve Hayward analysis
Phosphates tell a different story, because the strait is also the world’s main sulfur route. Sulfur is used to make the phosphoric acid in DAP and MAP; Morocco and Indonesia, the two largest buyers of Gulf sulfur, each took more than three million tonnes through the strait in 2025, and FAO estimated that their second-quarter supply of phosphates and ammonia fell by 30% to 50%.31 Saudi Arabia, which supplies about a fifth of the world’s phosphate fertilizer and normally exports 400,000 tonnes a month, redirected part of its output to Red Sea ports by rail and truck, at volumes well below normal; by October, AMIS still described its shipments through the strait as limited and Near East nitrogen exports as curtailed.32 DAP was 28% dearer in September than in February, above its 2025 range while urea had returned to its own (Exhibit 5), and the World Bank’s October forecast has the fertilizer index up 14% for 2026 as a whole before falling 12% in 2027, with urea averaging $510 a tonne this year and $429 next.33
Exhibit 5
Urea has returned to its 2025 range; DAP has not.
Monthly average prices of urea (f.o.b. Middle East) and DAP (f.o.b. US Gulf), January 2025 to September 2026, $ per tonne
| Month | Urea | DAP |
|---|---|---|
| Jan 2025 | 380.5 | 582.7 |
| Feb 2025 | 436.5 | 603.8 |
| Mar 2025 | 394.5 | 615.1 |
| Apr 2025 | 386.9 | 635.0 |
| May 2025 | 392.0 | 669.2 |
| Jun 2025 | 420.5 | 715.4 |
| Jul 2025 | 496.0 | 736.0 |
| Aug 2025 | 507.7 | 795.1 |
| Sep 2025 | 461.1 | 780.6 |
| Oct 2025 | 394.4 | 754.0 |
| Nov 2025 | 409.3 | 708.3 |
| Dec 2025 | 392.5 | 627.5 |
| Jan 2026 | 415.4 | 619.2 |
| Feb 2026 | 472.0 | 626.5 |
| Mar 2026 | 725.6 | 658.3 |
| Apr 2026 | 856.9 | 725.3 |
| May 2026 | 770.5 | 769.5 |
| Jun 2026 | 453.1 | 783.8 |
| Jul 2026 | 400.0 | 781.3 |
| Aug 2026 | 390.0 | 793.5 |
| Sep 2026 | 407.5 | 800.6 |
Note: Nominal US dollars. Urea is the prilled spot price; the April 2022 peak was $925 for urea and $954 for DAP.
Source: World Bank, Commodity Price Data (The Pink Sheet), October 2, 2026; Reeve Hayward analysis
Supply from the Gulf itself has only partly returned. Qatar declared force majeure in March on contracts for LNG and related products including urea, and FAO reported in June that output in Qatar and Bahrain had been halted and Iran’s was running at about half of capacity, while plants in the UAE and Oman operated under comparatively normal conditions.34 Industries Qatar, QAFCO’s owner, reported fertilizer production of 2.87 million tonnes in the first nine months of 2026 against 7.15 million a year earlier, and sales of 1.71 million tonnes against 4.43 million; its third-quarter sales of 351,000 tonnes were almost four times the second quarter’s 93,000, a sign of volumes starting to move, at an average price of $345 a tonne against $700 in the second quarter.35 Fertiglobe exported the equivalent of 56% of its UAE production in the second quarter and shifted about 100,000 tonnes of urea shipments into the third.36 The World Bank lists an extension of Qatar’s force majeure as an upside risk to prices and notes that infrastructure damage is likely to delay a full recovery of urea production.37
Who depends on Gulf fertilizer
The buyers of Gulf fertilizer are concentrated. India took 7.2 million tonnes through the strait in 2025, 23% of the total, across urea, DAP, ammonia and sulfur; Morocco and Indonesia bought sulfur for their phosphate industries; Brazil, Australia, the United States and Thailand bought urea (Exhibit 1).38 Customs data show how deep the dependence runs for urea in particular (Exhibit 6). In 2024, importers’ own declarations put the share of urea bought from the eight Gulf countries at 89% for Sri Lanka, 87% for Tanzania, 81% for Kenya, 77% for South Africa, 74% for Thailand, 68% for Australia, 40% for Brazil and 38% for the United States; India, which reports by value, bought 72% of its urea imports from the Gulf, 4.8 million tonnes.39 FAO’s trade matrix adds Bangladesh at 53% of its fertilizer imports from the Gulf, Jordan at 79%, Sudan at 54% and Kenya at about 40%; the Near East also supplies about 30% of sub-Saharan Africa’s fertilizer, with East Africa the most exposed.40
Exhibit 6
Ten large importers bought between 38% and 89% of their urea from the Gulf in 2024.
Urea imports from the eight Gulf countries as a share of total urea imports, by importing country, 2024 and 2025, % of import weight
| Importer | 2024 | 2025 |
|---|---|---|
| Sri Lanka | 89 | 34 |
| Tanzania | 87 | 42 |
| Kenya | 81 | 72 |
| South Africa | 77 | 67 |
| Thailand | 74 | 71 |
| India (by value) | 72 | 40 |
| Australia | 68 | 64 |
| Brazil | 40 | 35 |
| Mexico | 39 | 29 |
| United States | 38 | 30 |
Note: Importers’ own customs declarations; the eight Gulf countries include Oman, which ships from outside the strait. India is shown by value because its declarations carry no weight. 2025 is as reported to Comtrade by October 2026 and may be revised.
Source: UN Comtrade, HS 310210, accessed October 30, 2026; Reeve Hayward analysis
What this means for harvests is a matter of timing. AMIS judged in May that the shock was “less a food security crisis than a sustained challenge to farm profitability,” because crop prices had not risen with fertilizer prices, unlike in 2022, which squeezes what farmers can afford to apply.41 Brazil, which depends almost entirely on imports for urea and routes up to 40% of them through the strait, saw local urea prices rise 35% in two weeks and had covered only about 30% of its needs for the season starting in September; Australia took more than half of its urea from the Near East in 2025 and two-thirds in the April to July window.42 The IFA’s scenarios put world nitrogen use in 2026/27 at 117.5 million tonnes after a three-month disruption and 114.5 million after twelve months, against 118.9 million expected before the hostilities, with Oceania, Africa, Latin America and West Asia the most exposed regions.43 FAO’s Director-General warned in May that fertilizer scarcity would lower yields in the second half of 2026 and in 2027, and an OECD scenario summarised by AMIS, with oil at $115, raises agricultural commodity prices 4.5% in 2026 and 8.3% in 2027, mainly through fertilizer costs.44 The World Bank’s adverse scenario, in which the disruption persists, puts food commodity prices 12% above its baseline in 2027 and grains 20% above, narrowly higher than in 2022.45
Food: Prices up worldwide, supply held in the Gulf
Food prices have risen, but from the cost side rather than from a shortage of grain. The FAO index rose 8.4% between February and September 2026; cereals rose 13%, vegetable oils 14% and sugar 32%, while dairy fell.46 The World Bank counted cereal prices up 18% since June, with maize up 26% and wheat 22%, and found food inflation running ahead of headline inflation in 22% of 150 countries, against 14% before the hostilities, most acutely in the Middle East, Africa and South Asia.47 World cereal production in 2026 is put at 2,979 million tonnes, and the stocks-to-use ratio at 31.7%, so the strain is on price and logistics, not on availability.48 The IMF expects food prices to rise 5% in 2026 and 2.4% in 2027, reflecting energy and fertilizer costs and dearer transport and insurance.49
The human cost falls on poorer importers. WFP estimated in March that up to 45 million more people could become acutely food insecure if the conflict lasted beyond mid-2026 with oil above $100, and by June reported 2.5 million more Somalis and up to 1.3 million more Sri Lankans unable to afford a basic food basket.50 IFPRI’s modelling of 20 low- and middle-income countries attributes more of the rise in undernourishment to fertilizer prices than to fuel.51
The Gulf: Stocks, routes and a diversified supplier base
The Gulf states buy most of their food abroad. FAO puts their import dependence at 70% to 90% of supply, and the region imports about 100 million tonnes of food a year, some 274,000 tonnes a day.52 Customs data put Saudi Arabia’s food imports at $30.8 billion in 2025, 12% of its merchandise imports, Kuwait’s at $6.7 billion, Oman’s at $6.3 billion, Qatar’s at $4.0 billion in 2024 and Bahrain’s at $2.3 billion; the UAE’s $22.2 billion in 2023 includes a large re-export trade.53 The suppliers are spread across continents: India, Russia, Argentina and Australia for cereals, Brazil for meat, New Zealand and the Netherlands for dairy.54 Three things cushioned the shock. Grain stocks stood at four to six months of use; Saudi Arabia produces 131% of its dairy needs, 103% of its eggs and 72% of its poultry; and the Red Sea and Indian Ocean coasts gave Saudi Arabia, the UAE and Oman ports outside the strait.55 Food inflation has stayed contained in Saudi Arabia, at 1.4% in August, and rose to 7.3% in Dubai in the second quarter with higher shipping and logistics costs.56
Qatar: Reserves, routes and local production did their job
Qatar imported QAR 14.2 billion ($3.9 billion) of food in 2025, 10% of its merchandise imports, from a base no single country dominates: India supplied 10.8%, the UAE 8.1%, Brazil 6.5%, Australia 5.1% and Saudi Arabia 4.8%.57 Relative to what the country earns abroad, the bill is the lightest in the Gulf: FAO puts Qatar’s food imports at 3% of its merchandise exports, against 7% for Saudi Arabia and Oman.58 In the first two months of 2026 food imports ran 8% above the same months of 2025, at QAR 2.65 billion, the last official monthly figures published.59
The response to the disruption followed a rehearsed plan. Qatar’s strategic stock of food and consumer goods is governed by Law No. 24 of 2019, and the Minister of Commerce and Industry reported in April that it had been reinforced during the disruption and not drawn on, that alternative air, sea and land routes had been activated with each able to meet the country’s needs alone, and that Qatar Airways had flown in about 2,000 tonnes of fruit and vegetables and more than 1,200 tonnes of red meat.60 The Minister of Municipality, who chairs the food security monitoring committee, described supply as stable including in a scenario of a closed strait, with reserves being reinforced with wheat and rice.61 The Abu Samra crossing with Saudi Arabia stayed open to goods, Hassad Food ran what its chief executive called a pre-approved multi-route strategy, and the state subsidised shipping costs to hold retail prices; the ministries carried out about 3,000 inspections a day.62 Consumer food prices rose with freight, 12.7% year on year in June, while headline inflation was 2.2%; in 2025 food prices had been flat on the year.63
The infrastructure was built for this. Hamad Port, which handles more than 95% of Qatar’s seaborne imports and is designed for 7.5 million containers a year, received more than 90,000 tonnes of grain between May and July; the strategic food security facilities beside it, 51 silos with 300,000 tonnes of storage for rice, sugar and edible oil on a dedicated berth, were 98% complete in June.64 Container volumes through Qatar’s ports ran at 648,119 TEU in the first nine months, a lower level than the 1,110,980 of the same months of 2025, as cargo shifted between sea, air and land routes; bulk cargo, the category that includes grain and feed, was 3.7% higher at 506,321 tonnes.65 Local production has grown into a second line of defence under the National Food Security Strategy 2030: fresh poultry and dairy reached 99% self-sufficiency in 2025, strategic vegetables 47%, from 39% a year earlier and against a 2030 target of 55%, and fish 67% against a target of 80%.66 Milk and dairy output rose from 56,146 tonnes in 2017 to 197,526 tonnes in 2023, three and a half times, after Baladna flew in 4,000 cows within 36 days of the June 2017 land-border closure.67
That 2017 episode is the closest precedent, and it reads well. Saudi Arabia and the UAE had supplied 28% of Qatar’s food imports in 2016. When the land border closed in June 2017, food imports fell 40% year on year in that month, then rose 10% in July, 11% in the third quarter and 21% in the second half, with Turkey supplying 3.3 times and Oman 3.8 times their 2016 values; for 2017 as a whole, food imports were 4.2% higher than in 2016.68 Mwani Qatar opened direct services from Hamad Port to Sohar and Salalah, three sailings a week each, within days.69 The supplier base rebuilt in 2017 is the one that absorbed the shock of 2026.
Alternative routes: What exists, what it carries, what it costs
Every bypass of the strait runs through Oman, the UAE’s east coast or Saudi Arabia’s Red Sea ports, and then overland (Exhibit 7). The volumes moved in 2026 show that these routes work; the rates show what they cost.
Exhibit 7
The bypass routes carried record volumes in 2026, at several times the usual cost.
Routes that avoid the Strait of Hormuz: capacity, use in 2026 and cost indicators, as stated
| Route | Capacity and 2026 use | Cost indicator |
|---|---|---|
| Oman: Sohar, Salalah, Duqm; road corridors to the UAE | All Omani ports: 146 million tonnes in January to August 2026, +62%; more than 4 million TEU, +21%. Sohar 52 million tonnes in the first half, +52%. Salalah 2.33 million TEU in the first half, with monthly records in August and September | Salalah to Dubai by truck, 40-foot container: $3,000 to $5,000 (Drewry benchmark). Goods crossing Oman’s land border rose from $300 million in February to $830 million in March |
| UAE east coast: Khor Fakkan, Fujairah; Etihad Rail | Khor Fakkan from about 8,000 to 65,000 TEU a week; capacity 3.5 million TEU rising to 5, 7 and 10 million over 36 months, $2 billion. Fujairah terminals 720,000 TEU a year. Rail to Fujairah: hundreds of thousands of TEU a year on single track | China to Khor Fakkan spot rate $10,626 per 40-foot container in mid-September, +479% since February |
| Saudi Arabia: Jeddah, King Abdullah Port, Yanbu, NEOM; road to Riyadh, Dammam and the Gulf | Jeddah 540,107 TEU in July, a record, 90% of the national total; weekly deployed capacity at Jeddah and King Abdullah Port +19% by April. Landbridge rail, about 1,500 km, SAR 100 billion, due 2034. Jeddah to Dammam about 1,400 km by road | Jeddah to Jebel Ali by truck: SAR 4,000 before, SAR 18,000 to 21,000 in April. China to Jeddah $10,870, +256%. Maersk discharges at Jeddah only for Saudi consignees |
| Pipelines (energy only) | Saudi East–West line 7 million barrels a day, about 2 used; UAE Habshan–Fujairah 1.5 to 1.8; 3.5 to 5.5 spare in early 2026; 5.6 million barrels a day exported by pipeline bypass in September | The East–West line was attacked on 11 September; the World Bank notes bypass routes “are also vulnerable to disruption” |
| Air freight | Middle East carriers’ cargo demand fell 54% in March and had recovered to +4% year on year by September. Qatar Airways flew in about 2,000 tonnes of fruit and vegetables and more than 1,200 tonnes of red meat by mid-April | Europe to Middle East air rate $3.12 a kilogram on 11 October, +85% on the year; jet fuel more than double its 2025 price |
| Through the strait | 1,482 transponder-tracked transits from March 1 to October 25, 7% of the 2025 level; dry bulk carriers fell least | War-risk cover about 0.1% of hull value before, 2% to 3% in March, 3% to 10% in July. Maersk: $3,000 emergency rate per 40-foot box for the upper Gulf plus $1,000 per Hormuz transit |
| GCC Railway (planned) | More than 1,700 km linking all six states, over 50% complete, due end-2030 | Not yet available |
Note: Volumes and rates as published by the operator, authority or data provider named in the source line; “before” means the period before 28 February 2026. Rail projects are shown with their published completion dates.
Source: Oman MTCIT; SOHAR Port; Port of Salalah; Gulftainer; Mawani; Saudi Arabia Railways; IEA; GCC Railways Authority; Maersk; Xeneta; The Loadstar; IATA; Reeve Hayward analysis
Oman, the UAE and Saudi Arabia
Oman is the natural bypass, and its numbers are the clearest. Omani ports handled about 146 million tonnes of cargo in the first eight months of 2026, up 62%, with more than 11,000 ship calls and over 4 million containers; Sohar’s throughput rose 52% in the first half, including 24 million tonnes of ship-to-ship transfers, and Salalah set monthly container records in August and September.70 The Sharjah–Oman corridor opened on 14 May with Sohar as its gateway, and customs declarations on the Dubai–Oman corridor rose from about 12,000 in March to about 100,000 in April.71 On the UAE’s own Indian Ocean coast, Gulftainer took Khor Fakkan from about 8,000 containers a week before the hostilities to 65,000 by July and plans to lift capacity from 3.5 million to 10 million TEU a year within three years at a cost of $2 billion; the company says it could absorb 80% to 90% of the UAE’s container demand if the strait closed again.72 The scale of the shift is visible at Jebel Ali, inside the strait, which handled 374,000 containers in the second quarter, 90% fewer than a year earlier, and about 3.1 million in the first half, down 60%; DP World signed terms in July for two new terminals at Fujairah, on the Indian Ocean side, partly to reduce reliance on the strait.73
Saudi Arabia turned west. Jeddah Islamic Port handled a record 540,107 containers in July, 90% of a national total that was itself 17.5% lower than a year earlier, and some 20,000 trucks a day moved cargo inland.74 The road is the limit: a truck from Jeddah to Jebel Ali that cost about SAR 4,000 before the hostilities cost SAR 18,000 to 21,000 in April, with demand four to five times the supply of vehicles, and by September Maersk and Hapag-Lloyd would discharge at Jeddah only for Saudi consignees, routing cargo for Qatar, Kuwait, Bahrain and the UAE through Salalah and Khor Fakkan instead.75 The Red Sea route has its own exposure: on 29 July the Joint War Committee extended its listed area northwards to include Jeddah, the WTO reports that flows diverted through the Red Sea were interrupted by further escalation in September, and PortWatch shows port calls at Jeddah, up about a quarter in the second quarter, running 63% to 85% below 2025 levels from August to October.76 The planned Landbridge railway between Jeddah, Riyadh and Dammam, about 1,500 kilometres of new track at a reported SAR 100 billion, is due in 2034; the GCC Railway, more than 1,700 kilometres linking all six states, is over half built and due at the end of 2030.77 For oil the pipelines did more: Saudi Arabia and the UAE had 3.5 to 5.5 million barrels a day of spare bypass capacity in early 2026, and exports by these routes reached 5.6 million barrels a day in September, until the East–West line itself was attacked on 11 September.78
What rerouting costs
The cost of avoiding the strait shows up in four lines of a shipper’s invoice. Freight: the spot rate from China to Jebel Ali was heading towards $6,000 per 40-foot container by early April, more than 270% above February, and by mid-September China to Jeddah stood at $10,870 and China to Khor Fakkan at $10,626; the Shanghai index for the Gulf and Red Sea lane was 318% higher on 8 October than a year before.79 Surcharges: Maersk’s emergency rate for the upper Gulf, including Qatar, is $1,800 per 20-foot and $3,000 per 40-foot dry container, $3,800 for refrigerated boxes, plus $1,000 per container on any vessel that transits the strait and $25 per TEU a day for storage after two weeks.80 Insurance: Howden Re put war-risk cover for a Hormuz transit at 0.10% to 0.125% of hull value before the hostilities and 2% to 3% by late March, and Marsh reported 3% to 10% in July, which for a $100 million ship is $3 million to $10 million a voyage; the Joint War Committee added Qatar, Kuwait, Bahrain, Oman and Djibouti to its listed areas on 3 March.81 Haulage: the Jeddah truck rate rose four- to five-fold, and Drewry’s benchmark for Salalah to Dubai is $3,000 to $5,000 per 40-foot container over about 1,700 kilometres.82 Air freight, the fastest route, carried fruit, vegetables and meat at $3.12 a kilogram from Europe in October, 85% more than a year earlier, with jet fuel more than double its 2025 price.83
The Red Sea crisis of 2024 is the nearest comparison for how such costs settle. Suez Canal transits fell 42% from their peak in the first weeks and 46% for 2024 as a whole; war-risk cover rose from under 0.1% to 0.7% to 1% of ship value; the Shanghai to Europe spot rate rose 256%; and Egypt lost about $6 billion of canal receipts in 2024.84 UNCTAD had earlier estimated that about half of the 2022 rise in food prices came from higher transport costs.85 Hormuz is more concentrated in what it carries, and the rate increases in 2026 have been larger.
Cost and benefit: What a long disruption costs, and what the alternatives save
No institution has published a single cost of the Hormuz disruption, but the IMF’s October decomposition comes closest, and it is also the clearest statement of what the bypass routes are worth (Exhibit 8). Without supply flexibility, the Fund estimates, the closure would have taken oil to about $110 a barrel and cut global growth by 0.9 percentage points in 2026; rerouting, higher output elsewhere and stock draws reduced that by 0.5 points, and lower oil intensity by a further 0.1, leaving a net cost of 0.3 points.86 In other words, the pipelines, ports and trucks described above recovered more than half of the economic cost of the closure. The Fund’s downside, in which fighting continues to the end of June 2027 with Hormuz and Bab el-Mandeb largely closed, takes oil to $130, 40% above baseline in 2027, and global growth 0.5 points lower in that year.87
Exhibit 8
Rerouting recovered more than half of the closure’s cost to global growth, at a price paid by shippers and insurers.
Published estimates of the cost of the disruption, what the alternatives recovered and what they cost, 2026, as stated
| Item | Estimate | Source |
|---|---|---|
| Cost of the closure without workarounds | Oil about $110; global growth −0.9 pp in 2026 | IMF, Oct 2026 |
| Recovered by rerouting, other output and stock draws | +0.5 pp; lower oil intensity a further +0.1 pp; net cost −0.3 pp | IMF, Oct 2026 |
| Downside: disruption to mid-2027 | Oil $130; growth −0.5 pp in 2027; inflation +1.1 pp | IMF, Oct 2026 |
| Food commodity prices | +10% in 2026, +7% in 2027; adverse case 12% above baseline in 2027 | World Bank, Oct 2026 |
| Fertilizer prices | +14% in 2026, −12% in 2027; urea $510 then $429 a tonne | World Bank, Oct 2026 |
| Fertilizer use, 12-month disruption | World nitrogen use 114.5 Mt in 2026/27, 3.7% below the pre-conflict forecast | IFA, May 2026 |
| People at risk | Up to 45 million more acutely food insecure if oil stays above $100 | WFP, Mar 2026 |
| Insurance losses | Lloyd’s £1.4 billion net in the first half; marine insurers $1.5 to 2 billion of claims by August | Lloyd’s; IUMI |
| Freight and insurance per shipment | 40-foot box to the Gulf about $10,600 to $10,900 (+256% to +479%); war-risk 2% to 3% of hull value in March, 3% to 10% in July, from about 0.1%; Maersk $3,000 + $1,000 per box | Xeneta; Howden Re; Marsh; Maersk |
| Capacity being built | Khor Fakkan to 10 million TEU, $2 billion; Saudi Landbridge SAR 100 billion by 2034; GCC Railway by 2030 | Gulftainer; SAR; GCC Railways Authority |
Note: Estimates are from the publishers named and are not additive; each measures a different thing. “pp” is percentage points of global GDP growth.
Source: IMF; World Bank; WFP; FAO; IFA; Lloyd’s; IUMI; Gulftainer; Saudi Arabia Railways; Maersk; Marsh; Reeve Hayward analysis
Set against these costs, the alternatives are cheap. The $2 billion Khor Fakkan expansion, the SAR 100 billion Landbridge and the GCC Railway are one-off investments; spread over their build periods, even the Landbridge is a few billion dollars a year, while the IMF’s 0.5 points of global growth recovered by rerouting is worth several hundred billion dollars of output in a single year.88 The trade-off for a Gulf importer is similar in kind. A container that costs $3,000 to $5,000 more to land through Salalah or Jeddah is still a container that lands; the FAO’s March modelling of a Gulf with no policy response, in which trade flows fell 80% during a blockade, showed household food consumption falling 17% to 20%, and the response that followed, reserves, air bridges and overland routes, is why that scenario has not been observed.89 For fertilizer exporters the sum runs the other way. There is no overland route for more than 20 million tonnes a year of urea and sulfur: Saudi Arabia’s rail and truck shipments of phosphate to the Red Sea stayed well below normal, and Qatar’s and Bahrain’s output waited on the strait, which is why the cost of a long disruption falls on next year’s harvests rather than on this year’s Gulf supermarkets.90
Risks and signposts
Nine risks follow from the evidence above. We place them on a map of likelihood over the next twelve months and impact on food and fertilizer markets (Exhibit 9). One sits in the very high band: a disruption that outlasts the IMF’s March 2027 assumption. Four sit in the high band: smaller harvests in 2027 where fertilizer was cut, deeper food inflation in low-income importers, attacks on or listing of the bypass routes, and freight and insurance that stay at several times their 2025 levels. The placements are our judgment, based on the scenarios and data cited in this report, and the map is meant to be redrawn as the signposts below move.
Exhibit 9
The largest risks are a disruption that outlasts March 2027 and the harvests sown at 2026 fertilizer prices.
Risks to food and fertilizer markets from the Hormuz disruption, by likelihood over the next twelve months and impact, Reeve Hayward assessment
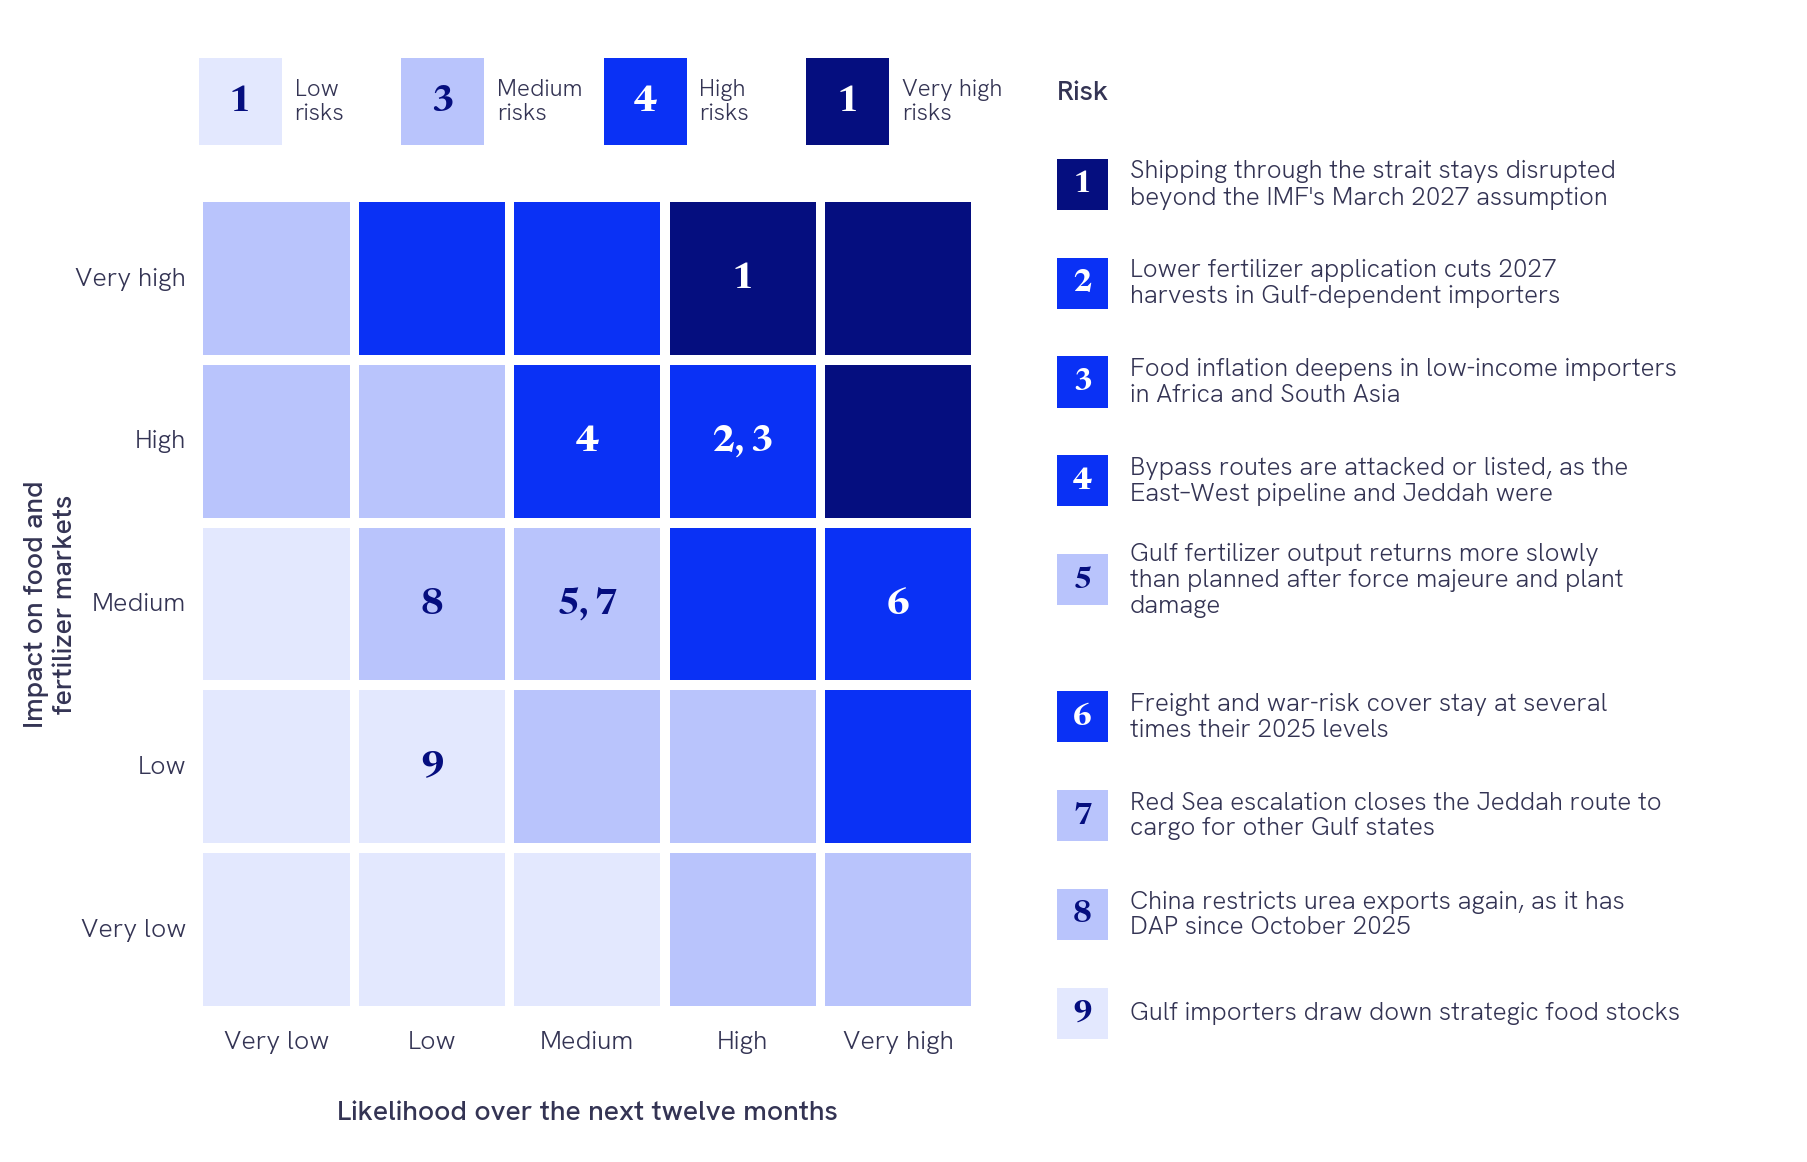
Note: Cells are shaded by severity band (likelihood plus impact). Likelihood and impact are analytical judgments based on the sources cited in this report, not measured probabilities.
Source: Reeve Hayward assessment, drawing on IMF, World Bank, IFA, FAO, AMIS, WFP, IMF PortWatch, the Joint War Committee and the sources cited above
In order of the timing of the next data point, these are the indicators we will follow:
- The FAO Food Price Index for October, due 6 November. September’s 136.0 was the highest since November 2022; cereals have led the rise since June.
- Transits through the strait. PortWatch’s count has stayed below 13 a day in every month since March; the IMF baseline needs it to recover from March 2027 and Fitch’s base case assumes a durable agreement in the first quarter of 2027.91
- Fertilizer volumes from Qatar and Saudi Arabia. Industries Qatar’s fourth-quarter sales and any change to Qatar’s force majeure will show whether the third quarter’s recovery in volumes continues; AMIS’s November monitor will say whether Saudi shipments through the strait remain limited.
- The next planting seasons. Brazil’s season from September and South Asia’s rabi season from November are the first harvests sown at 2026 fertilizer prices; the IFA’s nitrogen scenarios and the World Bank’s adverse case both turn on how much farmers cut back.
- Bypass capacity and its security. Khor Fakkan’s 5 million TEU step, the Landbridge timetable and the GCC Railway’s progress set how much can move overland; the 11 September attack on the East–West pipeline is a reminder that the alternatives are also exposed.
The strait’s importance to food runs through fertilizer, and the cost of a long disruption is mostly deferred: it arrives in the harvests of 2027 in countries that bought most of their urea and sulfur from the Gulf, and in a freight bill that has settled at several times its 2025 level. Alternative routes have done what they were built to do for the Gulf’s own imports, and the IMF’s arithmetic suggests they recovered more than half of what the closure would otherwise have cost the world economy. They do not exist for the Gulf’s fertilizer exports, which is where the next year’s risk sits.
A plan that works only when the strait is open is a plan with a missing page.
For companies in Qatar and the Gulf, the practical lessons are the ones the country applied in 2017 and again in 2026. Hold stock of what cannot be replaced quickly, contract for more than one route in and out, and price the extra freight into plans rather than hoping it reverts. The same discipline belongs in the feasibility studies in Qatar on which new food, logistics and manufacturing projects are financed: a plan that works only when the strait is open is a plan with a missing page.
About this report
This report draws on official statistics, institutional reports, company releases and press reports read on October 30, 2026: the World Bank Pink Sheet, the FAO Food Price Index, IMF PortWatch, the WTO Hormuz tracker, USGS, UN Comtrade, Qatar's National Planning Council and Mwani Qatar, with analysis from the IFA, FAO, AMIS, the IMF, the World Bank, UNCTAD, the IEA and WFP. Prices change daily; statements about what could happen are analytical judgments, not forecasts; and the report takes no position on the regional hostilities, which it describes as a disruption of shipping. It describes markets and published data; it does not value any company or recommend any security or commodity. It is for information only and is not investment advice.
The Research team at Reeve Hayward prepared this report in Doha. To discuss the findings, contact the team at info@reevehayward.com or +974 5577 4811.
Sources
- UNCTAD, “Strait of Hormuz Disruptions: Implications for Global Trade and Development,” March 10, 2026 (Clarksons data).
- UNCTAD, “Hormuz shipping disruptions raise risks for energy, fertilizers and vulnerable economies,” March 10, 2026.
- International Fertilizer Association (IFA), “Medium-Term Fertilizer Outlook 2026–2030: Summary report and background on Strait of Hormuz disruption,” May 6, 2026.
- World Bank, “Commodity Price Data (The Pink Sheet),” monthly prices, updated October 2, 2026; Reeve Hayward analysis.
- World Bank, “Commodity Price Data (The Pink Sheet),” October 2, 2026.
- FAO, “FAO Food Price Index,” release of October 2, 2026.
- World Bank, “Commodity Markets Outlook,” October 28, 2026; IMF, “World Economic Outlook: Resilience Under Strain, Urgent Choices,” October 13, 2026, chapter 1.
- IFA, “Medium-Term Fertilizer Outlook 2026–2030,” May 6, 2026, pp. 8–10 and 19–23.
- Howden Re, “Strait of Hormuz: (Re)insurance impact,” March 26, 2026, p. 12; Marsh, as reported in The National, July 17, 2026; Xeneta, as reported in The Loadstar, September 15, 2026; A.P. Moller-Maersk, “Middle East Operational Update 49,” September 23, 2026.
- FAO, “Global Agrifood Implications of the 2026 Conflict in the Middle East,” Information Note, March 15, 2026.
- Oman Ministry of Transport, Communications and Information Technology, as reported in Oman Observer, October 21, 2026; Saudi Ports Authority (Mawani), as reported in Arab News, August 12, 2026; Gulftainer, as reported in The National, July 7, 2026.
- National Planning Council, “Qatar Imports 2025–2026,” data.gov.qa, accessed October 30, 2026; Minister of Commerce and Industry, Qatar News Agency, April 14, 2026.
- UNCTAD, “Strait of Hormuz Disruptions,” March 10, 2026.
- UNCTAD, “Review of Maritime Transport 2025,” chapter II, September 2025.
- Chatham House, “Chokepoints and Vulnerabilities in Global Food Trade,” June 2017.
- FAO, “Cereal Supply and Demand Brief,” October 2, 2026.
- IFA, “Medium-Term Fertilizer Outlook 2026–2030,” May 6, 2026.
- FAO, “Food Outlook: Biannual Report on Global Food Markets,” June 2026, fertilizer market update; World Bank, “Commodity Markets Outlook,” April 2026, p. 34.
- IFA, “Medium-Term Fertilizer Outlook 2026–2030”; US Geological Survey, “Mineral Commodity Summaries 2026,” nitrogen and sulfur, February 2026; Reeve Hayward analysis.
- QAFCO, “2024 ESG Report,” July 2025.
- IMF PortWatch, “Daily Chokepoints Data,” downloaded October 30, 2026; Reeve Hayward analysis. The tracker counts ships with transponders on; the IEA reports oil flows through the strait of 10.9 million barrels a day in September, so physical traffic is higher than the count.
- UNCTAD, “Hormuz disruption deepens global economic strain across trade, prices and finance,” April 1, 2026.
- IMF PortWatch, “Daily Chokepoints Data,” by vessel type; Reeve Hayward analysis.
- WTO, “Strait of Hormuz Trade Tracker,” daily indices to October 29, 2026 (AXSMarine data); Reeve Hayward analysis of monthly averages.
- IMO, “Statement on the ongoing crisis in the Strait of Hormuz,” August 28, 2026.
- IFA, “Medium-Term Fertilizer Outlook 2026–2030,” pp. 8–10 (AIS data).
- FAO, “Food Outlook,” June 2026, fertilizer market update.
- World Bank, “Commodity Price Data (The Pink Sheet),” October 2, 2026; World Bank, “Commodity Markets Outlook,” October 28, 2026, pp. 39–40; Reeve Hayward analysis.
- World Bank, “Pink Sheet,” October 2, 2026; AMIS, “Market Monitor No. 140,” July 2026; Reeve Hayward analysis.
- World Bank, “Commodity Markets Outlook,” October 28, 2026, p. 40.
- IFA, “Medium-Term Fertilizer Outlook 2026–2030,” p. 9; FAO, “Food Outlook,” June 2026.
- AMIS, “Market Monitor No. 138,” May 2026; FAO, “Food Outlook,” June 2026; AMIS, “Market Monitor No. 142,” October 2026.
- World Bank, “Commodity Markets Outlook,” October 28, 2026, Table 1 and pp. 39–40.
- World Bank, “Commodity Markets Outlook,” October 28, 2026, p. 40; FAO, “Food Outlook,” June 2026, p. 68.
- Industries Qatar, “Industries Qatar posts revenue of QR 8.1 billion for the nine-month period ended 30 September 2026,” October 28, 2026; Reeve Hayward analysis.
- Fertiglobe plc, “Management Discussion and Analysis Report for the Period Ended June 30, 2026,” July 28, 2026.
- World Bank, “Commodity Markets Outlook,” October 28, 2026, p. 40.
- IFA, “Medium-Term Fertilizer Outlook 2026–2030,” p. 9.
- UN Comtrade, HS 310210, importers’ declarations, accessed October 30, 2026; Reeve Hayward analysis. The eight countries are Bahrain, Iran, Iraq, Kuwait, Oman, Qatar, Saudi Arabia and the UAE.
- FAO, “Global Agrifood Implications of the 2026 Conflict in the Middle East,” March 15, 2026; AMIS, “Market Monitor No. 138,” May 2026.
- AMIS, “Market Monitor No. 138,” May 2026.
- AMIS, “Market Monitor No. 138,” May 2026.
- IFA, “Medium-Term Fertilizer Outlook 2026–2030,” pp. 19–23.
- FAO, “Strait of Hormuz crisis: fertilizer scarcity will affect next harvests and food supplies, FAO warns,” May 7, 2026; AMIS, “Market Monitor No. 140,” July 2026.
- World Bank, “Commodity Markets Outlook,” October 28, 2026, p. 9.
- FAO, “FAO Food Price Index,” October 2, 2026; Reeve Hayward analysis.
- World Bank, “Food and Nutrition Security Update No. 124,” September 28, 2026.
- FAO, “Cereal Supply and Demand Brief,” October 2, 2026.
- IMF, “World Economic Outlook,” October 2026, chapter 1, p. 9.
- WFP, “WFP projects food insecurity could reach record levels as result of Middle East escalation,” March 17, 2026; WFP, “WFP warning becomes reality,” June 5, 2026.
- IFPRI (Ringler, Glauber and Thurlow), “Polycrises across the food-energy-water-environment nexus,” presentation, May 6, 2026.
- FAO, “Global Agrifood Implications of the 2026 Conflict in the Middle East,” March 15, 2026.
- UN Comtrade, HS chapters 01–23, reporters’ declarations, accessed October 30, 2026; Reeve Hayward analysis.
- UN Comtrade, HS chapters 02, 04 and 10, 2023–24.
- FAO, Information Note, March 15, 2026; General Authority for Statistics (GASTAT), “Food Security Statistics 2024,” December 11, 2025.
- GASTAT, “Consumer Price Index, August 2026,” September 15, 2026; Central Bank of the UAE, “Quarterly Economic Review,” September 2026.
- National Planning Council, “Qatar Imports 2025–2026,” data.gov.qa, and foreign merchandise trade workbooks, npc.qa; Reeve Hayward analysis.
- FAOSTAT, “Food Security Indicators,” value of food imports in total merchandise exports, 2022–24 average, bulk download of July 10, 2026.
- National Planning Council, “Qatar Imports 2025–2026”; Reeve Hayward analysis.
- Minister of Commerce and Industry Sheikh Faisal bin Thani bin Faisal Al Thani, Qatar News Agency, April 14, 2026.
- Minister of Municipality Abdullah bin Hamad Al Attiyah, Qatar News Agency, April 5, 2026.
- Qatar News Agency, April 5 and 14, 2026.
- National Planning Council, consumer price index, June 2026, as reported by Qatar News Agency; data.gov.qa CPI dataset; Reeve Hayward analysis.
- Ministry of Transport and Mwani Qatar, “Hamad Port maintains its key role in supporting Qatar’s food security,” September 5, 2026; Ashghal, “Ashghal President inspects Hamad Port Food Security Facilities and Warehouses Project,” June 25, 2026.
- Mwani Qatar, “Performance Statistics,” monthly figures for Hamad, Doha and Al Ruwais ports, read October 30, 2026; Reeve Hayward analysis.
- Ministry of Municipality, World Food Day statement, as reported in The Peninsula, October 16, 2026; Qatar News Agency, August 25, 2025.
- National Planning Council, “Milk and Dairy Production,” data.gov.qa; Baladna, “Company Profile 2026.”
- National Planning Council, foreign merchandise trade workbooks 2016–2018, imports by HS chapter and origin; Reeve Hayward analysis.
- Mwani Qatar, as reported by Reuters, June 12, 2017.
- Oman MTCIT, as reported in Oman Observer, October 21, 2026; SOHAR Port and Freezone, as reported by MarineLink, August 19, 2026; Port of Salalah, as reported in Oman Observer, October 1, 2026.
- Sharjah Ports, Customs and Free Zones Authority, as reported by The New Arab, May 20, 2026; The Loadstar, May 21, 2026.
- Gulftainer, as reported in The National, July 7, 2026.
- DP World, “1H 2026 Results,” August 13, 2026.
- Mawani, as reported in Arab News, August 12, 2026; Reeve Hayward analysis.
- The Loadstar, April 24, 2026; Maersk, “Middle East Operational Update 49,” September 23, 2026.
- Joint War Committee, circular JWLA-034, July 29, 2026; WTO, “Global Trade Outlook and Statistics,” October 7, 2026; IMF PortWatch, “Daily Ports Data,” Jeddah, to October 23, 2026; Reeve Hayward analysis.
- Saudi Arabia Railways, as reported by MEED, January 21, 2026; GCC Railways Authority, as reported in The Peninsula, May 11, 2026.
- IEA, “Strait of Hormuz Factsheet,” February 2026; IEA, “Oil Market Report,” October 14, 2026.
- Xeneta, April 7–8, 2026; Xeneta, as reported in The Loadstar, September 15, 2026; Shanghai Shipping Exchange, as reported by Ti Insight, October 26, 2026.
- Maersk, “Middle East Operational Update 49,” September 23, 2026.
- Howden Re, “Strait of Hormuz: (Re)insurance impact,” March 26, 2026, p. 12; Marsh, as reported in The National, July 17, 2026; Joint War Committee, circular JWLA-033, March 3, 2026.
- The Loadstar, April 24 and March 17, 2026.
- Freightos, as reported by Ti Insight, October 26, 2026; IATA, “Air Cargo Demand Accelerates in September,” October 29, 2026.
- UNCTAD, “Navigating Troubled Waters,” February 2024; IMF PortWatch, Suez Canal daily transits; IMF, Egypt Extended Fund Facility review, as reported July 21, 2025; Reeve Hayward analysis.
- UNCTAD, “Navigating Troubled Waters,” February 2024, p. 15.
- IMF, “World Economic Outlook,” October 2026, chapter 1, p. 4 and Figure 1.3.
- IMF, “World Economic Outlook,” October 2026, Box 1.2.
- Reeve Hayward analysis of IMF, “World Economic Outlook,” October 2026; world GDP in 2025 was about $115 trillion in current dollars, so 0.5 percentage points of growth is about $575 billion of output. The comparison is illustrative, not an estimate of returns on any project.
- FAO, “Global Agrifood Implications of the 2026 Conflict in the Middle East,” March 15, 2026, section 4.1.
- FAO, “Food Outlook,” June 2026; AMIS, “Market Monitor No. 142,” October 2026.
- Fitch Ratings, as reported by Yeni Şafak, October 12, 2026.
To discuss what this means for your business, speak with our team. Initial conversations are confidential and without obligation.
Speak with our team


