

Borrowing for AI has more than doubled in 2026, and lenders are now hedging. This report traces who lends, how much, how able the borrowers are to repay, and what 2000 and 2007 can teach.
Debt now funds a growing share of the artificial intelligence (AI) build-out: Goldman Sachs expects about a third of the largest companies’ 2026 capital spending to be borrowed.1 Morgan Stanley estimates that AI-related debt issuance reached about $450 billion worldwide by early September 2026, more than double the total for all of 2025, according to the Bank of England’s Financial Policy Committee.2 Bloomberg data count at least $334.5 billion of bonds and loans raised for AI infrastructure by late July, against $185.5 billion in the whole of 2025.3 The largest technology companies, the so-called hyperscalers, now account for almost 10% of global investment-grade corporate bond issuance, up from 0.5% in 2024.4
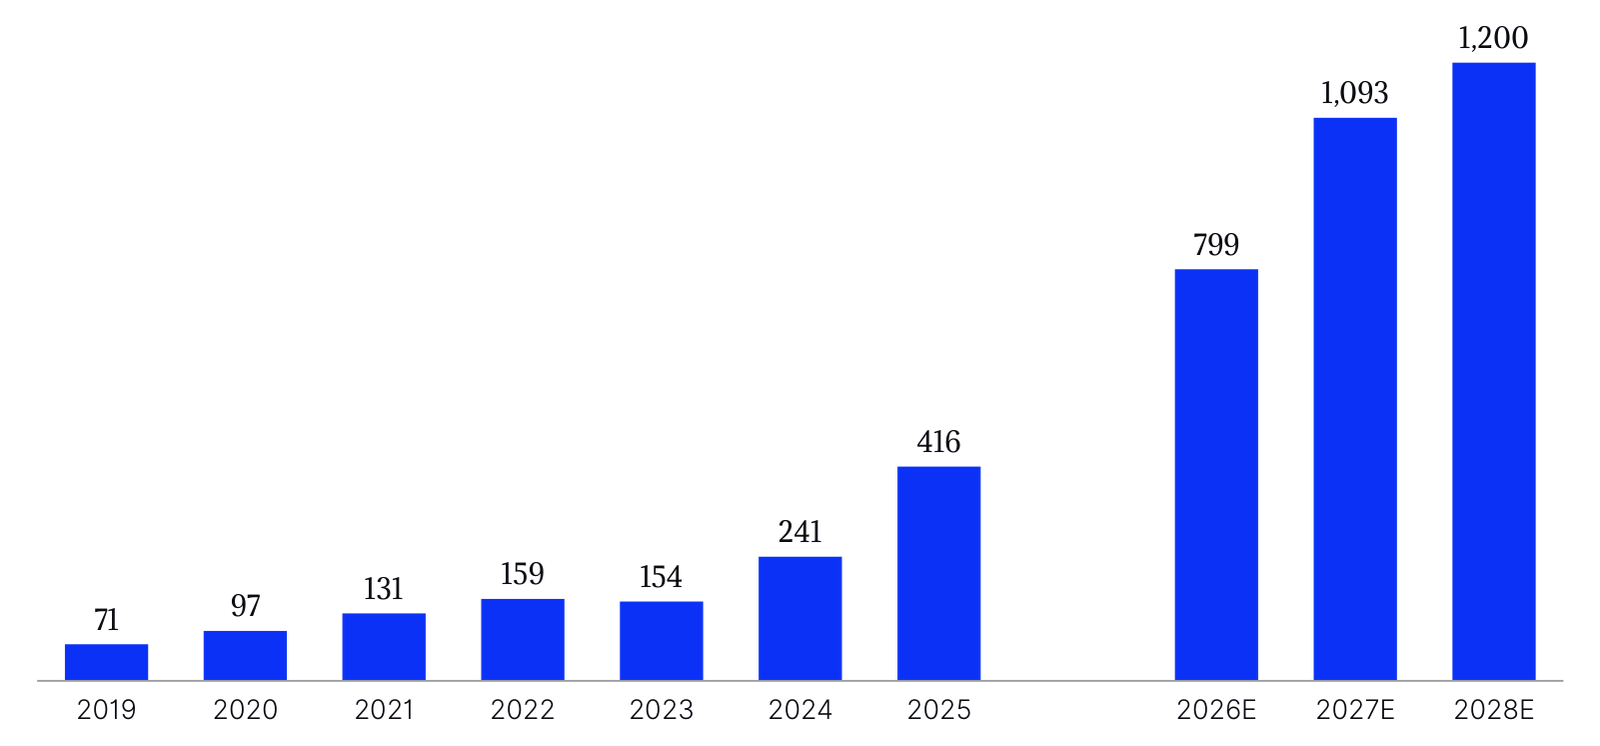
The borrowing follows the spending. The five largest hyperscalers, Alphabet, Amazon, Meta, Microsoft and Oracle, invested $416 billion in 2025, almost six times their 2019 level, and analysts expect $799 billion in 2026 and $1.09 trillion in 2027 (Exhibit 1).5 J.P. Morgan analysts expect about $4.1 trillion of AI-related capital expenditure to be financed with debt between 2026 and 2030.6
Exhibit 1
Hyperscaler capital spending is expected to almost double in 2026 and pass $1 trillion in 2027.
Capital expenditure of Alphabet, Amazon, Meta, Microsoft and Oracle, 2019–28, $ billion
Note: Company totals. 2026, 2027 and 2028 are consensus estimates as of September 30, 2026.
Source: J.P. Morgan Asset Management, Guide to the Markets U.S. 4Q 2026 (Bloomberg data); Reeve Hayward analysis
The strongest borrowers can carry this. The hyperscalers’ net debt, including leases signed but not yet started, was 1.3 times their earnings before interest, taxes, depreciation and amortization (EBITDA) in the second quarter, against 2.7 times for the median US investment-grade company.7 The pressure sits further out. Oracle, rated one notch above high yield, has $125 billion of borrowings and $288 billion of data center leases that have not yet started.8 CoreWeave, the largest of the independent AI cloud providers, pays interest equal to 23% of its revenue,9 and the price of insuring its debt against default passed 1,000 basis points in October, a level usually read as distress.10
Lenders have noticed. Investors and lenders have turned to credit default swaps (CDS), the contracts that pay out if a borrower defaults, and banks to risk-transfer deals that hedge their data center loans; trading in protection on AI names has grown fast.11 The IMF now lists an AI-driven market correction as one of three salient risks to the financial system.12
This report sets out who is borrowing and through which channels, how many AI companies there are and where, which lenders have provided the credit and how much they hold, how able the main borrowers are to repay, and how lenders are protecting themselves. It closes by comparing today with the telecom and dot-com bust of 2000 to 2002 and the credit crisis of 2007 and 2008. It describes markets and published filings; it does not value any company, recommend any security, or forecast defaults (see sidebar, “About the research”).
A trillion-dollar build-out, increasingly paid for with debt
Until recently the hyperscalers paid for most of their data centers out of their own cash. The Federal Reserve Bank of Dallas puts the investment made since 2023 at $500 billion to $600 billion, much of it funded from retained earnings, and the coming wave at $3 trillion to $5 trillion over three to five years.13 As spending outgrew cash flow, free cash flow fell and borrowing rose.14 The money now arrives through four channels, each with a different lender base.
Bonds: The largest channel
Corporate bonds remain the hyperscalers’ main source of debt. Goldman Sachs counts $108 billion of hyperscaler debt issued in 2025 and $194 billion in 2026 by early August, and nearly $500 billion of AI-related debt overall, of which the hyperscalers were only 40%.15 AI borrowers supplied 18% of US investment-grade issuance in 2026, up from 7% in 2025 and 1% in 2024, and 40% of bonds with maturities over 15 years.16 The first half of 2026 brought some of the largest corporate bonds on record: Amazon raised $36.9 billion in March, and Meta, Nvidia and Oracle about $25.0 billion each, with Alphabet at $19.9 billion.17 Even in sterling, hyperscalers supplied 47% of corporate bond issuance this year.18
Bank loans: Project finance for the campuses
Banks lend for specific campuses and as bridges to bonds or listings. In April, a $22.75 billion project-finance loan for Vantage Data Centers’ Texas campus, leased to Oracle, was the third-largest syndicated loan of the half-year worldwide.19 It forms part of a $38 billion package, with a Wisconsin loan of $14.75 billion, led by JPMorgan and MUFG.20 In March, SpaceX, which now includes xAI and X, signed a $20 billion unsecured bridge loan that repaid the debt of xAI and X, before its $86.25 billion stock market listing in June.21 SoftBank borrowed $40 billion for a year to fund its investment in OpenAI.22
Private credit and off-balance-sheet vehicles
The fastest-growing channel keeps debt off the hyperscalers’ balance sheets. The BIS describes the common structure: a joint venture or special-purpose vehicle builds the data center, raises debt from private credit funds and insurers, and leases the capacity to the hyperscaler, which holds a minority stake and may give guarantees. The BIS calls these obligations “shadow borrowing.”23 Meta’s Hyperion campus in Louisiana is the reference case. Funds managed by Blue Owl Capital own 80% of the joint venture, Meta 20%; Meta leases the campus for an initial four years and guarantees part of its residual value for 16 years.24 The vehicle sold $27 billion of 6.581% notes due 2049 to PIMCO and other bond investors.25 Morgan Stanley puts the financing and leasing structures kept off balance sheets across the sector at some $3 trillion, and expects private credit to fund $700 billion of data center spending from 2026 to 2028.26
Equity and equity-linked money
Borrowers have also turned back to shareholders. Alphabet priced an equity raise of about $85 billion in June, and Oracle plans to raise $45 billion to $50 billion in 2026, about half through shares and convertibles.27 Oracle sold $19.9 billion of shares through its at-the-market program in a single quarter.28 Some of this money circulates within the sector. The IMF reviewed 14 transactions since 2023 that combined about $300 billion of equity and $650 billion of debt in exchange for $1.4 trillion of future revenue commitments, often between suppliers and their own customers.29
Thousands of AI companies, a few dozen borrowers
The number of AI companies is large and rising. The Stanford AI Index counts 3,499 AI companies that received new funding in 2025, up 70.8% on 2024. The United States accounted for 1,953 of them, 56% of the total, ahead of the United Kingdom with 172 and China with 161 (Exhibit 2).30 Money is more concentrated still: private AI investment in the United States reached $285.9 billion in 2025, 23 times China’s $12.4 billion. Among Gulf states, Saudi Arabia drew $2.0 billion.31
Exhibit 2
The United States accounted for 56% of the AI companies that raised new funding in 2025.
Newly funded AI companies by country, 2025, top 15 of 3,499 worldwide, number of companies
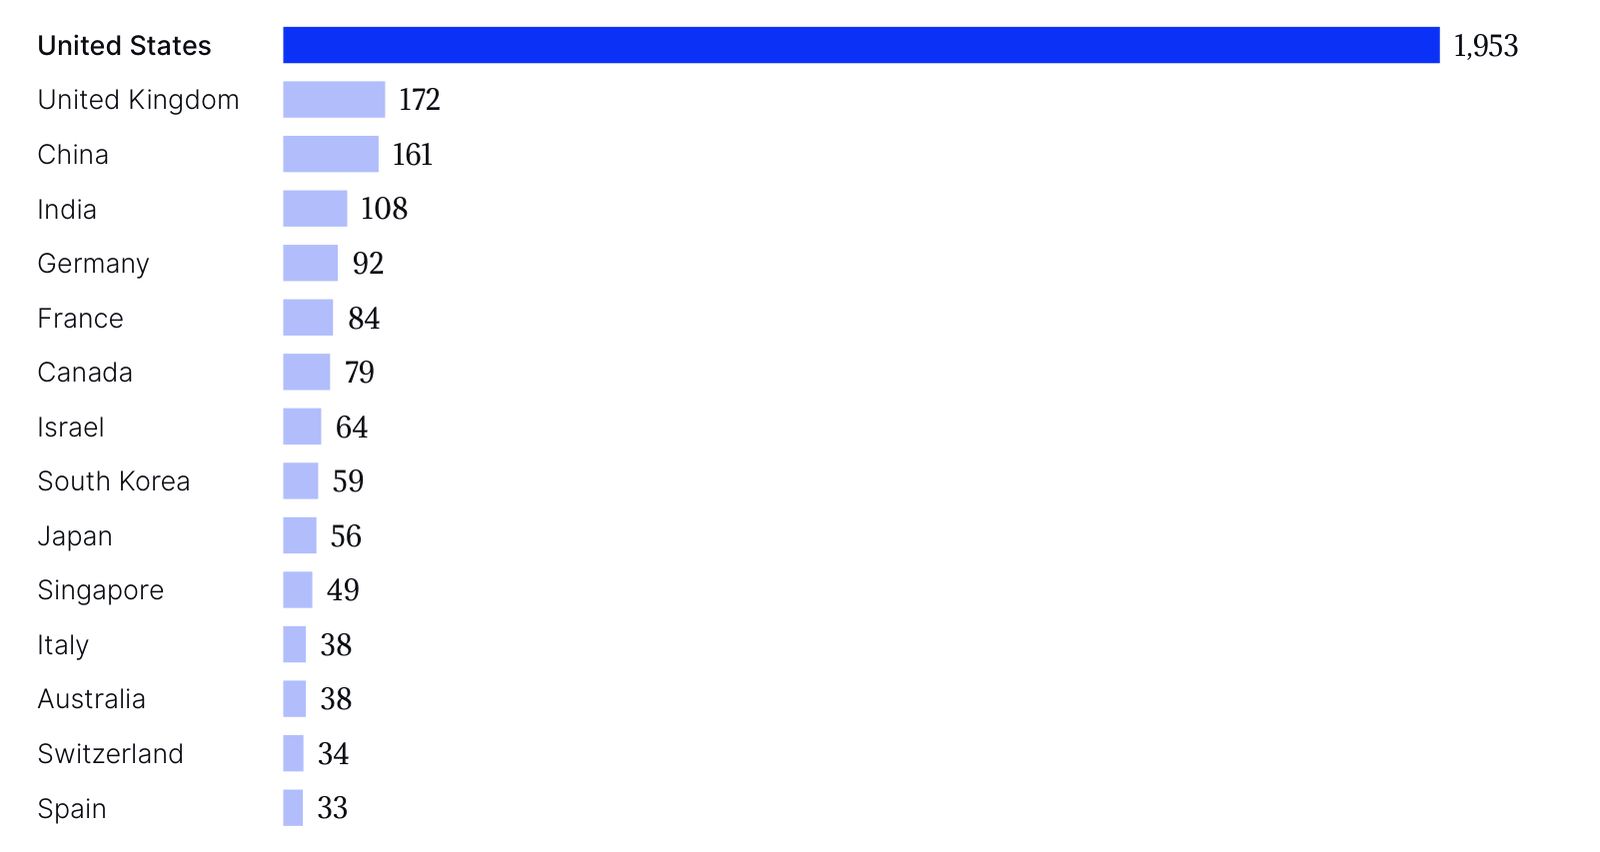
Note: AI companies in Quid’s private-investment data, which covers companies with more than $1.5 million of funding since 2013, that received new funding in 2025. Other countries account for the remaining 479 companies.
Source: Stanford HAI, Artificial Intelligence Index Report 2026, chapter 4 (Quid data); Reeve Hayward analysis
Debt reaches only a small part of this population. Start-ups are funded with equity; the borrowers are the hyperscalers, Oracle, chip makers such as Nvidia, the independent AI cloud providers known as neoclouds, such as CoreWeave, Nebius and IREN, and the data center developers and vehicles that build for them. The AI laboratories rely mainly on partners that borrow to build their computing capacity; OpenAI, for example, has a $300 billion computing agreement with Oracle.32 These laboratories are valued like large listed companies. Anthropic raised $65 billion at a $965 billion valuation in May,33 and OpenAI is reported to be raising $30 billion at $1.25 trillion.34
In public markets, AI-related industries make up 53.2% of the S&P 500, and the ten largest companies 40.6% of its value, against 18% to 21% at the start of 1985, 1995, 2005 and 2015.35 That concentration links the credit question to the equity market: the borrowers’ ability to refinance depends on investors’ continued confidence in AI earnings.
Who lends, and how much each holds
Large syndicates of US and Japanese banks dominate the loan market for AI campuses, private credit funds and insurers buy the long-dated debt of the vehicles, and bond investors hold the hyperscalers’ own debt (Exhibit 3). Individual lenders’ shares of a syndicated loan are rarely published, so exposure can be traced reliably only at the level of the deals and of the lender groups. Like the borrowers in Exhibit 2, the lenders come mainly from a few countries, above all the United States and Japan.
Exhibit 3
A small group of banks and private credit funds stands behind the largest AI financings.
Selected AI-related financings, 2025–26, and the lenders named in filings or reports, $ billion
| Borrower or vehicle | Amount | Instrument | Lenders or arrangers named |
|---|---|---|---|
| Vantage, Texas campus (Oracle) | 23.25 | Construction loan, 2026 | JPMorgan and MUFG (leads); Wells Fargo, BNP Paribas, Goldman Sachs, SMBC, Societe Generale |
| Vantage, Wisconsin campus (Oracle) | 14.75 | Construction loan, 2026 | JPMorgan and MUFG (leads) |
| Beignet Investor (Meta Hyperion) | 27.0 | Notes due 2049, 2025 | PIMCO and other bond investors; Morgan Stanley bookrunner |
| Meta Hyperion joint venture | 7.0 | Equity for 80% stake, 2025 | Funds managed by Blue Owl Capital |
| SoftBank Group (OpenAI stake) | 40.0 | Bridge loan, 2026 | JPMorgan, Goldman Sachs, Mizuho, SMBC, MUFG |
| SpaceX (with xAI and X) | 20.0 | Bridge loan, 2026 | Goldman Sachs (lead); Bank of America, Citi, JPMorgan, Morgan Stanley |
| CoreWeave | 8.5 | Term loan, March 2026 | MUFG (agent) and other lenders |
| CoreWeave | 3.1 | Term loan, May 2026 | Morgan Stanley (agent) and other lenders |
| Crusoe, Abilene campus | 7.1 | Construction loan, 2025 | JPMorgan (lead) |
| OpenAI | 0.52 | Loan, 2026 | Bank of America |
Note: Amounts are facility or issue sizes as announced, not each lender’s share. The Texas loan closed at $22.75 billion according to LSEG. The Hyperion notes were $27 billion at issue, sold to PIMCO and other bond investors.
Source: Company filings (CoreWeave 10-Q, SpaceX S-1, Meta); LSEG; Reuters; Bloomberg via Datacenter Dynamics; Morningstar DBRS; Reeve Hayward analysis
Banks
Five names recur. JPMorgan and MUFG led the $38 billion of Oracle-linked Vantage loans, JPMorgan led the $7.1 billion construction loan for Crusoe’s Stargate campus in Abilene, Texas, and Morgan Stanley and MUFG provided $2.6 billion to CoreWeave in 2025.36 Sumitomo Mitsui Banking Corporation (SMBC) led every US digital infrastructure loan league table for 2025, with MUFG and JPMorgan in the top three across several categories.37 The same banks arranged the bridges: Goldman Sachs for SpaceX, and JPMorgan, Goldman Sachs and the three Japanese megabanks for SoftBank.38 Agents for CoreWeave’s 2026 term loans include MUFG, Morgan Stanley and, from August, JPMorgan.39
Holding these loans has proved harder than arranging them. The banks behind the $38 billion of Oracle-linked loans took months to find buyers for their shares, Yahoo Finance reported in October.40 Credit Agricole was selling down a Hong Kong data center loan after reaching its own lending cap for the sector.41 Banks also lend to the private credit funds and vehicles that finance AI, which the BIS identifies as a new channel for shocks.42 Under the IMF’s adverse scenario, banks holding 22% of global banking assets would end with capital below regulatory limits, up from 18% a year earlier.43
Private credit funds and insurers
Private credit has become a major lender to technology firms. Worldwide, technology borrowers held more than $1 trillion of direct loans from private credit funds in 2025, 44% of the almost $2.5 trillion outstanding, up from 28% in 2019.44 Behind private credit stand insurers. Moody’s counts $85.2 billion of AI-linked investments held by US life insurers at the end of June 2026, 1.4% of their invested assets and 24% more than six months earlier. Of these, $32.2 billion is the debt of the five largest technology companies, about 6.6% of all their debt outstanding, including about $10 billion of Oracle’s and $8.5 billion of Amazon’s.45
Can the borrowers repay? Three tiers of credit
Ability to repay varies widely across the borrowers, and the evidence sorts them into three tiers (Exhibit 4).
Exhibit 4
Repayment capacity weakens sharply from the hyperscalers to Oracle and the neoclouds.
Selected credit measures for the main AI borrowers, latest reported quarter, as stated
| Measure | Five hyperscalers | Oracle | CoreWeave |
|---|---|---|---|
| Credit standing | Investment grade; Oracle the lowest | BBB- (S&P), cut in July 2026 | High yield |
| Debt | Net debt incl. leases 1.3x EBITDA (US IG median 2.7x) | $125.3 billion of borrowings | $35.6 billion of principal |
| Leases not yet started | Included above | $288 billion, 15–19 years | Not stated |
| Cash generation in the quarter | Free cash flow dwindling as capex rises | Operating cash $23.1 billion; capex $28.5 billion | Operating loss $49 million; net loss $626 million |
| Interest | Nearly $6 billion in the second quarter, double a year earlier | $1.43 billion, up 55% | $592 million, 23% of revenue |
| Contracted backlog (RPO) | Not aggregated | $664 billion | $103.7 billion |
| Five-year CDS spread | Not aggregated | 295 basis points | 1,145 basis points |
Note: Hyperscalers are Alphabet, Amazon, Meta, Microsoft and Oracle; their leverage includes leases signed but not yet started. Oracle’s quarter ended August 31, 2026, and CoreWeave’s June 30, 2026. CDS spreads are five-year, as reported on October 19 and 21, 2026. RPO = remaining performance obligations, the contracted revenue not yet recognized.
Source: J.P. Morgan Asset Management; IMF; Oracle and CoreWeave Form 10-Q; S&P Global Market Intelligence via CNBC; Reeve Hayward analysis
The hyperscalers: Strong balance sheets, thinner cash flow
The five hyperscalers can service their debt from operating income several times over, and the IMF judges their interest coverage comfortable. But their combined interest bill doubled in a year to nearly $6 billion in the second quarter, their bond spreads have widened by about 30 basis points more than the investment-grade index since April, and their bonds are approaching the weight of banks in the benchmark indices, which the IMF warns could spread any repricing across the credit market.46 Goldman Sachs estimates that the hyperscalers need roughly $300 billion of annual AI revenue to break even on their investment.47
Oracle: A contracted backlog, a long wait for cash
Oracle shows both the promise and the strain. Its contracted backlog rose 46% in a year to $664 billion, which Oracle attributes to large cloud contracts; the largest reported is a $300 billion computing deal with OpenAI. In the quarter to August, it spent $28.5 billion on capital projects, 3.4 times as much as a year earlier, against $23.1 billion of operating cash flow, leaving free cash flow of minus $5.4 billion. Interest expense rose 55% to $1.43 billion, still covered 4.7 times by operating income.48 On top of $125.3 billion of borrowings and $43.8 billion of recognized leases, Oracle has committed to $288 billion of data center leases starting between late 2026 and 2029, for terms of 15 to 19 years.49 S&P cut Oracle to BBB-, the lowest investment-grade rating, in July and said it could cut again if leverage stays above four times or if Oracle is not on a path to positive free operating cash flow by fiscal 2029. Analysts’ consensus expects free cash flow of minus $23.7 billion this year and minus $36 billion in 2027.50
The neoclouds: Growth funded at high-yield rates
CoreWeave doubled its revenue to $2.58 billion in the second quarter, but its operating loss of $49 million left nothing to pay $592 million of contractual interest, and it lost $626 million.51 Effective interest rates on its term loans and senior notes range from 7% to 15%; only its convertible notes cost less. It owes $35.6 billion of principal, of which $10.6 billion falls due by the end of 2027, almost twice its $5.5 billion of cash (Exhibit 5). The case for repayment rests on contracts: $103.7 billion of backlog and 98% of revenue from committed contracts.52 About two-thirds of the backlog is with investment-grade customers such as Microsoft and Meta, according to Deutsche Bank.53 The risk is concentration, with three customers producing 72% of second-quarter revenue. Analysts expect negative free cash flow of $10.1 billion in the third quarter and estimate that CoreWeave may need to raise about $30 billion in 2027, and credit desks told CNBC that the high-yield market was on hold until after the US midterm elections.54
Exhibit 5
CoreWeave must repay $10.6 billion by the end of 2027, almost twice its cash.
CoreWeave future principal payments on total debt, as of June 30, 2026, $ billion
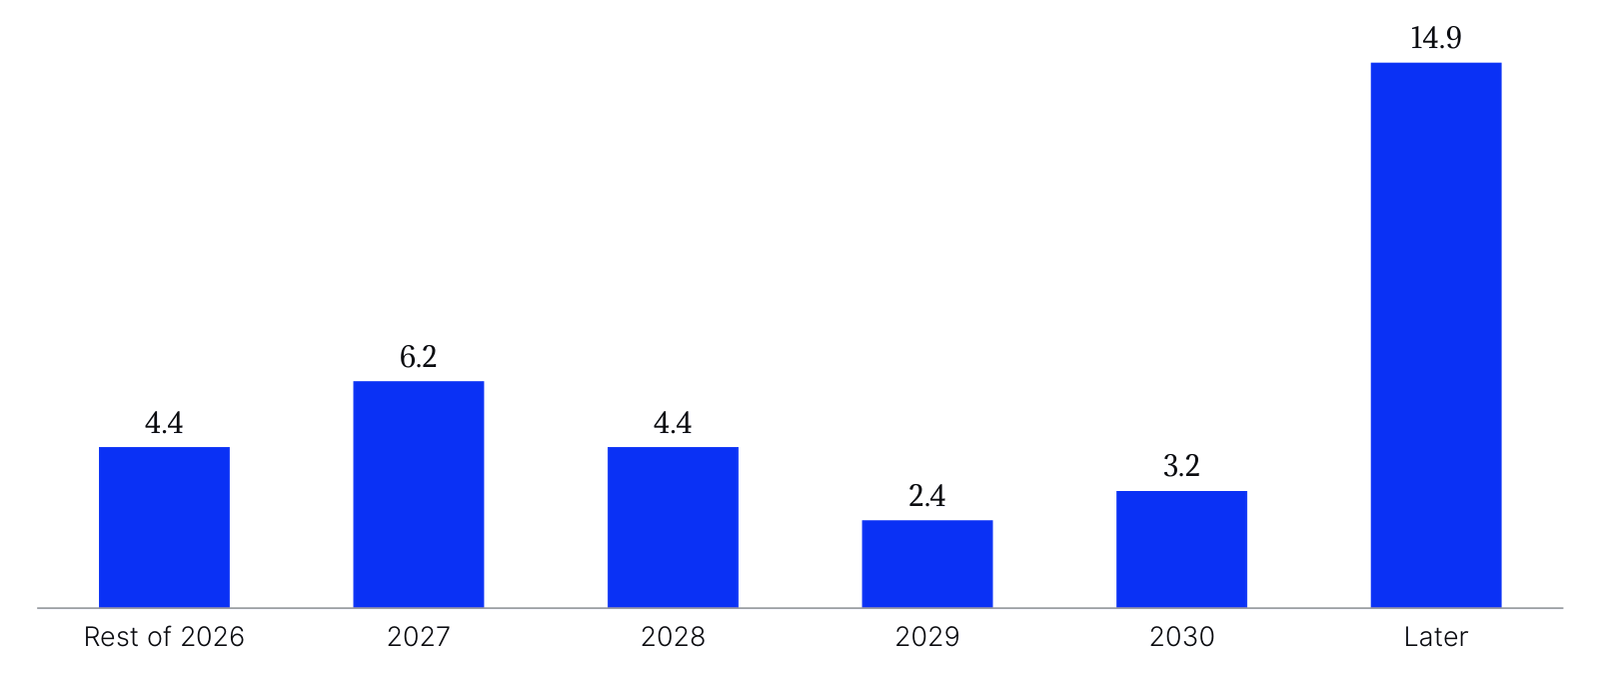
Note: Recourse and non-recourse debt; total $35.6 billion. Cash and cash equivalents were $5.5 billion on June 30, 2026.
Source: CoreWeave, Inc., Form 10-Q for the quarter ended June 30, 2026, note 10; Reeve Hayward analysis
The laboratories: Commitments ahead of revenue
The AI laboratories are the end customers of much of this debt. Their commitments to buy computing power run for many years, and they are funded mainly by equity from their suppliers and investors. OpenAI’s $110 billion funding round in February drew $30 billion each from Nvidia and SoftBank and $50 billion from Amazon, $15 billion of it up front; OpenAI also agreed to spend a further $100 billion on Amazon’s cloud over eight years.55 Lenders to Oracle, CoreWeave and the data center vehicles are, in effect, lending against these contracts. If a laboratory’s growth slowed, the strain would pass down the chain of leases and loans that the IMF describes as circular.56 For a borrower such as CoreWeave, that strain would arrive as the maturities in Exhibit 5 fall due.
Lenders are buying protection
A credit default swap pays the buyer if a borrower defaults; the price, quoted as an annual spread in basis points, is the market’s price of that risk. Banks buy protection to hedge the loans they hold, investors to hedge bonds or to bet on a decline. In 2026 AI borrowers became some of the most actively traded US corporate names.
Oracle was the most traded US corporate name in March, with 311 trades reported to US swap repositories, more than twice the next company.57 Its five-year spread stood at 295 basis points on October 19, up 287% in a year and in the range of BB and B credits, according to S&P Global Market Intelligence.58 CoreWeave’s reached 1,145 basis points on October 21, up 179% in a year, while its 9.75% bond due 2031 yielded 15.78% and its market value fell from a peak of about $90 billion to about $31 billion.59 The Hyperion notes traded at 91 cents on the dollar in late September, a yield of 7.55% and a spread of about 230 basis points over Treasuries, against 185 at launch.60
The hedging is deliberate. Bloomberg reported in November 2025 that the Oracle CDS market had grown into a hedge against an AI crash, and in March 2026 that JPMorgan was offering clients a basket of CDS to hedge AI debt.61 Banks have also used significant risk transfers, which pass part of a loan book’s losses to outside investors: Morgan Stanley explored one for its data center loans in late 2025, Societe Generale in March 2026, and Deutsche Bank hedged data center risk in a project-finance transfer in September.62 In October, the Financial Times reported a surge in default-insurance trading on AI debt.63 The BIS notes that CDS spreads rose most for the lower-rated hyperscalers, reflecting both the volume of new debt and doubts about the projects’ payoffs.64
What 2000 and 2007 can and cannot tell us
Two earlier episodes combined new technology, heavy borrowing and credit derivatives. Neither is a template, but each shows how losses travel.
2000 to 2002: The telecom debt behind the dot-com bubble
The dot-com bust is remembered for share prices: the Nasdaq Composite fell 78% from its peak of 5,049 on March 10, 2000, to 1,114 on October 9, 2002.65 The credit losses came from telecom companies that had borrowed to lay fiber ahead of demand. US investment in communications equipment more than doubled from about $62 billion a year in 1996 to over $135 billion in 2000, in 1996 dollars, while advances in transmission doubled the capacity of a single fiber about every nine months. The market value of S&P 500 telecom companies fell by about $700 billion from 2000 to 2002.66 Telecom firms produced 55% of all defaulted high-yield bond dollars in 2001 and 52% in 2002, more than $50 billion in 2002 alone, and lenders recovered only 16 cents on the dollar, against 25 cents across all defaults.67
The parallel with today lies in the assets. Fiber outlasted the companies that laid it. AI chips, by contrast, are depreciated over five to six years by the major technology firms, against ten to 15 years or more for the buildings,68 so the collateral behind GPU-backed loans could lose value faster than the loans amortize.
Valuations today are high, though below the 2000 peak (Exhibit 6). The S&P 500 traded at 19.0 times expected earnings at the end of September, against 25.2 times in March 2000, while the Shiller cyclically adjusted price-to-earnings ratio (CAPE), at 40.7 in October, is 92% of its December 1999 record.69 One difference is earnings: today’s largest companies earn 36.1% of the index’s profits, which supports much of their 40.6% weight.70
Exhibit 6
Valuations sit between the 2007 and 2000 peaks, and bond yields are higher than in 2007.
S&P 500 valuation measures at three market peaks, as stated
| Measure | March 2000 | October 2007 | Latest |
|---|---|---|---|
| S&P 500 forward P/E | 25.2x | 15.1x | 19.0x (September 30, 2026) |
| Shiller CAPE | 43.2 (record 44.2, December 1999) | 27.3 | 40.7 (October 2026) |
| 10-year Treasury yield | 6.2% | 4.7% | 5.3% |
| Dividend yield | 1.4% | 1.9% | 1.4% |
Note: Forward P/E is price over consensus earnings for the next 12 months. CAPE is price over ten-year average inflation-adjusted earnings, for the month shown.
Source: J.P. Morgan Asset Management, Guide to the Markets U.S. 4Q 2026 (FactSet, IBES, Federal Reserve); Robert J. Shiller, US stock market data, October 2026; Reeve Hayward analysis
2007 to 2008: When credit insurance concentrated the risk
The 2007 crisis began in housing and spread through derivatives. US house prices fell 27% from July 2006 to February 2012.71 Over-the-counter derivatives had grown to $673 trillion of notional value. AIG sold protection on $79 billion of mortgage securities without being required to hold capital against it and, unable to meet its obligations, received government commitments of more than $180 billion. Of the mortgage securities Moody’s rated triple A in 2006, 83% were later downgraded.72 The CDS market itself peaked at $61.2 trillion of notional at the end of 2007 (Exhibit 7).73
Exhibit 7
The credit default swap market is less than a fifth of its 2007 size.
Credit default swaps, notional amounts outstanding, all counterparties, end of each half-year, 2004–25, $ trillion
| Half-year | CDS notional |
|---|---|
| 2004 H2 | 6.4 |
| 2005 H1 | 10.2 |
| 2005 H2 | 13.9 |
| 2006 H1 | 20.4 |
| 2006 H2 | 28.7 |
| 2007 H1 | 45.2 |
| 2007 H2 | 61.2 |
| 2008 H1 | 60.8 |
| 2008 H2 | 44.9 |
| 2009 H1 | 39.1 |
| 2009 H2 | 35.8 |
| 2010 H1 | 31.1 |
| 2010 H2 | 30.7 |
| 2011 H1 | 33.4 |
| 2011 H2 | 29.0 |
| 2012 H1 | 27.3 |
| 2012 H2 | 25.5 |
| 2013 H1 | 24.5 |
| 2013 H2 | 21.1 |
| 2014 H1 | 19.6 |
| 2014 H2 | 16.5 |
| 2015 H1 | 14.7 |
| 2015 H2 | 12.4 |
| 2016 H1 | 11.8 |
| 2016 H2 | 9.9 |
| 2017 H1 | 9.7 |
| 2017 H2 | 9.4 |
| 2018 H1 | 8.3 |
| 2018 H2 | 8.1 |
| 2019 H1 | 7.8 |
| 2019 H2 | 7.6 |
| 2020 H1 | 8.8 |
| 2020 H2 | 8.4 |
| 2021 H1 | 8.8 |
| 2021 H2 | 8.8 |
| 2022 H1 | 9.3 |
| 2022 H2 | 9.7 |
| 2023 H1 | 9.9 |
| 2023 H2 | 8.5 |
| 2024 H1 | 9.0 |
| 2024 H2 | 9.0 |
| 2025 H1 | 11.1 |
| 2025 H2 | 11.0 |
Note: Single-name and multi-name contracts. 70.2% of the notional was cleared through central counterparties at the end of 2025.
Source: BIS, OTC derivatives statistics (WS_OTC_DERIV2); ISDA, Key Trends in the Size and Composition of OTC Derivatives Markets in the Second Half of 2025; Reeve Hayward analysis
Today’s market differs in three ways. It is smaller, at $11.0 trillion at the end of 2025, and 70% of it is cleared through central counterparties that collect margin.74 The largest AI borrowers are profitable companies with investment-grade ratings, valued at a lower multiple of their earnings than at the 2000 peak (Exhibit 6), rather than households with stretched mortgages. And much of the demand for protection on AI names comes from lenders hedging their loans; no seller of protection on the scale of AIG has been reported. The resemblances lie elsewhere: debt moved into off-balance-sheet vehicles, ratings resting on the credit of a sponsor, long-dated assets funded by investors who may need liquidity, and exposure concentrated on a few names, as the IMF and the BIS both point out.75
Signposts for the months ahead
In order of the timing of the next data point, based on scheduled filings and reported deadlines, these are the indicators we will follow:
- Hyperscaler results and 2027 capital spending plans. Third-quarter results due from late October will show whether spending guidance for 2027 holds near the $1.09 trillion consensus, and how much of it each company plans to fund with debt.
- CoreWeave’s third-quarter results and financing plan. Analysts expect negative free cash flow of about $10 billion in the quarter. The $6.2 billion of principal due in 2027 and a possible need of about $30 billion of new capital will test the high-yield market once it reopens.
- Oracle’s rating. S&P’s triggers are leverage above four times and no path to positive free operating cash flow by fiscal 2029. A cut to high yield could force sales by investors limited to investment-grade debt.
- Spreads on the most traded names. Oracle’s five-year CDS near 300 basis points and CoreWeave’s above 1,000 are the market’s running measure of AI credit risk; the Hyperion notes show how investors price off-balance-sheet structures.
- Policy. The IMF has asked authorities to consider sectoral capital requirements and concentration limits on banks’ exposures to AI and private credit.76 Any such step would change how much banks can hold.
AI borrowing has more than doubled in 2026, and most of it rests on companies that can carry it. The risk lies in the layers further out: the vehicles, neoclouds and project loans whose repayment depends on contracts with a few customers, funded at high-yield rates and secured on equipment that ages quickly. Lenders have begun to price that risk and to hedge it, which is a sign of discipline as much as of worry.
The build-out is likely to continue; the terms on which it is financed may not.
For lenders, investors and companies in the Gulf, where data center projects worth more than $93 billion are active or planned across the GCC,77 the lessons are practical. Test the cash flows behind each lease and offtake contract, match the tenor of the debt to the life of the equipment, and watch concentration on a few counterparties. The build-out is likely to continue; the terms on which it is financed may not.
About this report
The Research team at Reeve Hayward prepared this report in Doha, drawing on company filings, official statistics and analysis, and press reports read between October 24 and 27, 2026. Assessing a borrower's cash flows, contracts and capital structure is the same discipline we apply in our business valuations in Qatar. To discuss the findings, contact the team at info@reevehayward.com or +974 5577 4811.
This publication does not constitute an offer or recommendation to buy, sell, or hold any security, loan or derivative. Market prices change daily, and statements about what could happen are analytical judgments, not forecasts. It is for information only and is not investment advice.
Sources
- Goldman Sachs, “How AI debt is reshaping the credit market,” Goldman Sachs Exchanges, August 5, 2026.
- Bank of England, “Financial Policy Committee Record, September 2026,” September 30, 2026, citing Morgan Stanley and J.P. Morgan estimates.
- Bloomberg data, as reported in “Hong Kong data centre loan sale shows banks limiting sector exposure,” The Business Times, July 29, 2026.
- International Monetary Fund (IMF), “Rising Leverage in the AI Ecosystem,” Global Financial Stability Report, Background Analysis 1.1, October 2026.
- J.P. Morgan Asset Management, “Guide to the Markets, U.S., 4Q 2026,” slide 22 (Bloomberg consensus estimates), data as of September 30, 2026.
- Bank of England, “Financial Policy Committee Record, September 2026.”
- J.P. Morgan Asset Management, “Guide to the Markets, U.S., 4Q 2026,” slide 37.
- Oracle Corporation, Form 10-Q for the quarter ended August 31, 2026, September 11, 2026.
- Reeve Hayward analysis of CoreWeave, Inc., Form 10-Q for the quarter ended June 30, 2026, August 11, 2026.
- CNBC, “CoreWeave credit default swaps hit distress levels as investors sour on AI debt,” October 15, 2026.
- Bloomberg, “A Hedge Against AI Crash Emerges as Oracle CDS Market Explodes,” November 20, 2025; Financial Times, “AI debt worries spark surge in default insurance trading,” October 20, 2026.
- IMF, “Global Financial Markets Face Rising Risks From AI, Bond Yields, and Cyberattacks,” IMF Blog, October 13, 2026.
- Federal Reserve Bank of Dallas, “How AI debt financing impacts duration supply and interest rates,” February 10, 2026.
- IMF, “Rising Leverage in the AI Ecosystem,” October 2026.
- Goldman Sachs, “How AI debt is reshaping the credit market,” Goldman Sachs Exchanges, August 5, 2026.
- Goldman Sachs, “How AI debt is reshaping the credit market.”
- LSEG Deals Intelligence, “Global Debt Capital Markets Review, First Half 2026,” July 2026.
- Bank of England, “Financial Policy Committee Record, September 2026.”
- LSEG Deals Intelligence, “Global Syndicated Loans Review, First Half 2026.”
- Datacenter Dynamics, “Oracle set to receive $38bn debt package for data center projects,” 2025, reporting Bloomberg; Octus, “Banks prep series of multibillion-dollar debt offerings for Oracle,” 2026.
- Space Exploration Technologies Corp., Form S-1, May 20, 2026; LSEG Deals Intelligence, “Global Equity Capital Markets Review, First Half 2026.”
- Reuters, “SoftBank secures $40 billion loan to boost OpenAI investments,” March 27, 2026.
- BIS, “Financing the AI infrastructure boom: on- and off-balance sheet borrowing,” BIS Quarterly Review, March 16, 2026.
- Meta Platforms, “Meta Announces Joint Venture with Funds Managed by Blue Owl Capital to Develop Hyperion Data Center,” October 21, 2025.
- Reuters column by Jamie McGeever, “Are AI credit cracks a warning, or a ‘buy’ signal?,” as published by The Edge Malaysia, September 30, 2026; Meta Platforms, press release, October 21, 2025.
- Morgan Stanley estimates, as cited in the Reuters column of September 30, 2026 and by the Bank of England, “Financial Policy Committee Record, September 2026.”
- IMF, “Rising Leverage in the AI Ecosystem,” October 2026.
- Oracle Corporation, Form 10-Q, September 11, 2026.
- IMF, “Global Financial Markets Face Rising Risks From AI, Bond Yields, and Cyberattacks,” October 13, 2026.
- Stanford Institute for Human-Centered AI, “Artificial Intelligence Index Report 2026,” chapter 4, figures 4.2.4 and 4.2.9 (Quid data).
- Stanford Institute for Human-Centered AI, “Artificial Intelligence Index Report 2026,” figure 4.2.8.
- CNBC, October 19, 2026.
- Reuters, “Anthropic’s valuation surges to $965 billion, surpassing OpenAI,” May 28, 2026.
- TechCrunch, “OpenAI working on new $30B raise at $1.25T valuation ahead of IPO,” October 22, 2026.
- J.P. Morgan Asset Management, “Guide to the Markets, U.S., 4Q 2026,” slides 8, 9 and 11.
- Morningstar DBRS, “Powering the AI Economy: How Banks Are Managing Their Growing Data Centre Risk Exposure,” August 27, 2026.
- TMT Finance, “SMBC, Milbank top TMT Finance’s inaugural US Digital Infrastructure Loans League Tables for 2025,” PR Newswire, February 11, 2026.
- Space Exploration Technologies Corp., Form S-1; Reuters, March 27, 2026.
- CoreWeave, Inc., Form 10-Q, August 11, 2026, notes 10 and 16.
- Yahoo Finance, “Banks arranged $38 billion in AI debt. Finding buyers took months,” October 15, 2026.
- The Business Times, July 29, 2026, reporting Bloomberg.
- BIS, “Financing the AI infrastructure boom,” March 16, 2026.
- IMF, IMF Blog, October 13, 2026.
- BIS, “Financing the digital economy: the role of private credit,” BIS Quarterly Review, September 14, 2026.
- Moody’s Ratings, as reported in “US life insurers increase AI investments as exposure risks grow, says Moody’s,” Reinsurance News, October 23, 2026.
- IMF, “Rising Leverage in the AI Ecosystem,” October 2026.
- Goldman Sachs estimate, as cited in the Reuters column of September 30, 2026.
- Oracle Corporation, Form 10-Q, September 11, 2026; CNBC, October 19, 2026.
- Oracle Corporation, Form 10-Q, note 6.
- CNBC, “Credit stress is threatening to unwind the AI bull. All eyes are on Oracle to hold the line,” October 19, 2026, citing S&P and FactSet.
- CoreWeave, Inc., Form 10-Q, August 11, 2026.
- CoreWeave, Inc., Form 10-Q, August 11, 2026; Reeve Hayward analysis.
- CNBC, October 15, 2026, citing a Deutsche Bank note.
- CNBC, “CoreWeave’s market confidence erodes as bond yields spike, stock sinks,” October 21, 2026, citing FactSet and Baird.
- Reuters, “OpenAI’s $110 billion funding round draws investment from Amazon, Nvidia, SoftBank,” February 27, 2026.
- IMF, IMF Blog, October 13, 2026.
- Clarus Financial Technology, “Volumes and most active names in credit derivatives – March 2026,” April 2026, based on SEC security-based swap data repositories.
- CNBC, October 19, 2026.
- CNBC, October 15 and 21, 2026.
- Reuters column by Jamie McGeever, September 30, 2026.
- Bloomberg, November 20, 2025; Bloomberg, “JPMorgan Offers Clients a New CDS Basket to Hedge AI Debt Risk,” March 23, 2026.
- Fortune, “Morgan Stanley considers offloading some of its data-center exposure,” December 4, 2025; Bloomberg, “Societe Generale Considers SRT Deal for Data Center Loan Exposure,” March 19, 2026; Bloomberg, “Deutsche Bank Hedges Data Center Risk in Project Finance SRT,” September 7, 2026.
- Financial Times, October 20, 2026.
- BIS, “Financing the AI infrastructure boom,” March 16, 2026.
- Nasdaq Composite Index, daily closes, Federal Reserve Bank of St. Louis (FRED), series NASDAQCOM; Reeve Hayward analysis.
- Elise A. Couper, John P. Hejkal and Alexander L. Wolman, “Boom and Bust in Telecommunications,” Federal Reserve Bank of Richmond Economic Quarterly, Fall 2003.
- Edward I. Altman and Gonzalo Fanjul, “Defaults and Returns in the High Yield Bond Market: The Year 2002 in Review and the Market Outlook,” NYU Stern Working Paper FIN-03-010, 2003.
- Federal Reserve Bank of Dallas, February 10, 2026.
- J.P. Morgan Asset Management, “Guide to the Markets, U.S., 4Q 2026,” slides 4 and 5; Robert J. Shiller, US stock market data (shillerdata.com), October 2026 workbook; Reeve Hayward analysis.
- J.P. Morgan Asset Management, “Guide to the Markets, U.S., 4Q 2026,” slide 8.
- S&P CoreLogic Case-Shiller U.S. National Home Price Index, FRED series CSUSHPINSA; Reeve Hayward analysis.
- Financial Crisis Inquiry Commission, The Financial Crisis Inquiry Report, January 2011, pp. xxiv–xxv.
- BIS, OTC derivatives statistics, credit default swaps, notional amounts outstanding (dataset WS_OTC_DERIV2); Reeve Hayward analysis.
- ISDA, “Key Trends in the Size and Composition of OTC Derivatives Markets in the Second Half of 2025,” July 2026, from BIS data.
- IMF, “Rising Leverage in the AI Ecosystem,” October 2026; BIS, “Financing the AI infrastructure boom,” March 16, 2026.
- IMF, IMF Blog, October 13, 2026.
- Kamco Invest, “GCC Projects Market Update,” October 2026, citing MEED Projects.
To discuss what this means for your business, speak with our team. Initial conversations are confidential and without obligation.
Speak with our team


