

Three approaches set the frame, but four inputs decide the answer: the discount rate, country risk, growth, and the discounts for size and marketability. Here is how each is set for a Qatari company today.
Valuing a private company in Qatar is less a question of method than of four inputs: the discount rate, the premium for country risk, the growth assumed after the forecast period, and the discounts for size and for the difficulty of selling a private stake. The International Valuation Standards (IVS), in force since January 31, 2025, leave the method open: the valuer must consider the market, income, and cost approaches and select the most relevant for the intended use.1 The inputs are where the result is made. Qatar’s country risk premium is 0.61% on a rating basis and 0.70% on a credit default swap (CDS) basis in Aswath Damodaran’s July 2026 tables, the closest agreement between the two methods anywhere in the Gulf (Exhibit 1).2 Listed Qatari companies traded at 10.7 times trailing earnings on October 11, 2026, below every Gulf market except Dubai.3 And the 10-year US Treasury yield, the anchor for a riyal pegged to the dollar, stood at 5.24% on October 9, 2026.4
Shareholders bringing in a partner, families planning succession, boards weighing an offer, and finance teams reporting under IFRS all need a number they can defend. This explainer sets out how the three approaches apply to a Qatari private company and how each of the four inputs is set in October 2026.
Exhibit 1
Qatar’s country risk premium is the same within a tenth of a point whichever way it is measured; Saudi Arabia’s and Oman’s are not.
Country risk premium by estimation method, GCC markets, July 2026, percentage points added to the mature-market equity risk premium
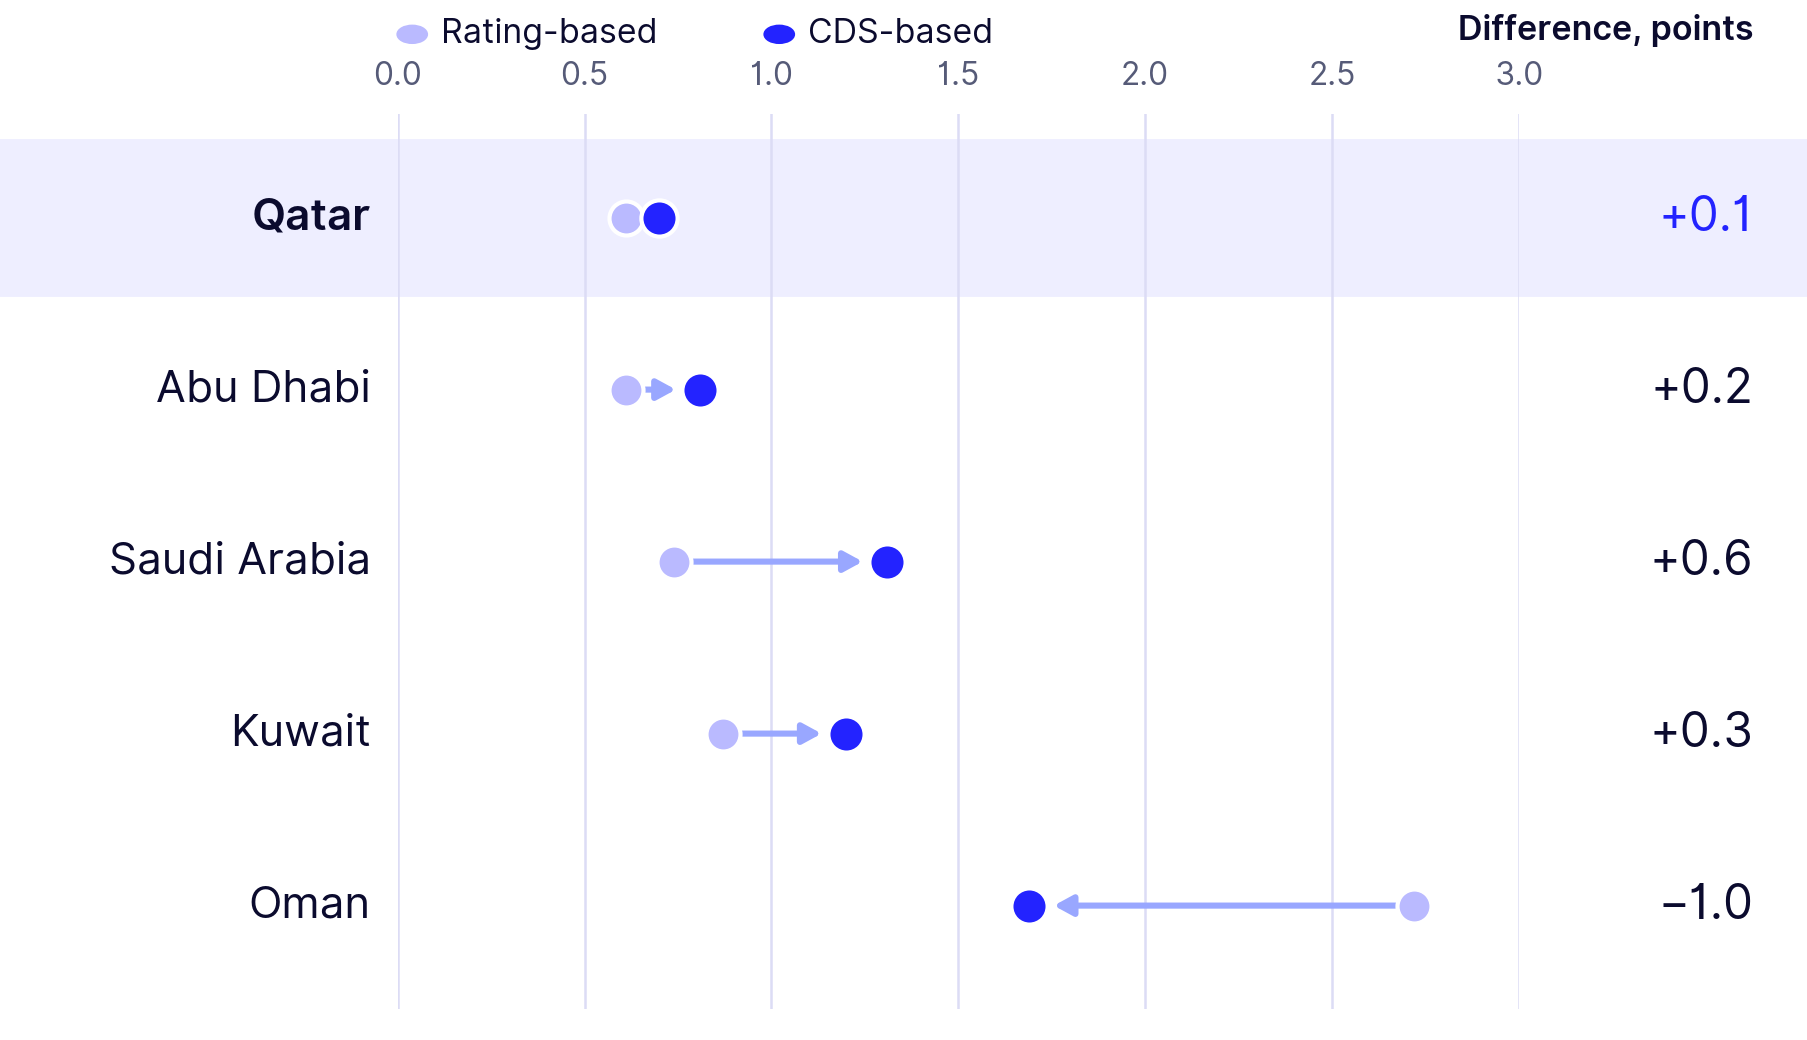
Note: The rating-based premium scales the default spread for the Moody’s local-currency rating (Qatar Aa2, 0.39%) by 1.55, the relative volatility of emerging-market equities to sovereign bonds; the CDS-based premium does the same with the sovereign CDS spread net of the Swiss spread (Qatar 0.45%). Bahrain (B2: 6.81 and 4.45) is omitted to keep the scale readable. The UAE has no CDS quote; Abu Dhabi is shown.
Source: Aswath Damodaran, NYU Stern, “Country Default Spreads and Risk Premiums,” July 2026 update, default spreads corrected July 9, 2026; Reeve Hayward analysis
Start with the approach a buyer would use
IVS 103 says the choice of approach should maximize the use of observable inputs. The market approach, which compares the business with similar assets that have observable prices, is to be given significant weight when the company itself has recently been sold, when it or close peers are actively traded, or when there are frequent transactions in similar businesses close to the valuation date.1 For most private companies in Qatar none of these holds. Only 53 companies traded on the Qatar Stock Exchange on October 11, 2026, spread across banks, industrials, transportation, real estate, insurance, telecoms, and consumer goods, and private transaction prices are rarely disclosed.3
That is why the income approach, usually a discounted cash flow (DCF) of the company’s own plan, carries the most weight for a trading business, with listed multiples as a cross-check. The cost approach, which values the business at its assets less its liabilities, fits holding companies, property-heavy businesses, and companies whose earnings do not support what they own. Where more than one method is used, IVS requires the results to be reconciled into a single conclusion without averaging.1
Build the discount rate from observable inputs
The discount rate is where most valuation disputes in Qatar start, and most of its parts can be observed (Exhibit 2). Because the riyal is pegged to the dollar, the base is the US Treasury curve: 5.24% for ten years and 5.65% for twenty on October 9, 2026.4 Qatar’s own credit sits just above it. On September 27, 2026, the Ministry of Finance priced a $1.0 billion five-year bond at 55 basis points over Treasuries and a $2.0 billion ten-year bond at 65 basis points, after a $7.7 billion order book allowed 30 basis points of tightening.5 Fitch affirmed Qatar at AA with a stable outlook in September 2026, and Moody’s rates it Aa2, also stable.6, 7
Two published premiums do most of the remaining work. Damodaran’s mature-market equity risk premium was 4.20% in July 2026, and his country risk premium for Qatar adds 0.61%.2 Kroll’s recommended US equity risk premium is 5.0%, reaffirmed on March 23, 2026, paired with the higher of a normalized risk-free rate of 3.5% or the spot 20-year Treasury yield; Kroll said then that an escalation of the conflict in the region could lead it to raise the figure.8 Beta comes from listed peers. Damodaran’s January 2026 emerging-market tables give unlevered betas, corrected for cash, of 0.45 for real estate development, 0.61 for food processing and for engineering and construction, 0.78 for healthcare support services, 0.89 for general retail, and 1.11 for business and consumer services, each to be re-levered at the subject company’s own debt.9
Two local features change the arithmetic. Qatar’s corporate income tax is a flat 10%, but a company wholly owned by Qatari nationals and by GCC nationals resident in Qatar pays none, so the tax shield on debt that lowers a weighted average cost of capital elsewhere is small or absent for many Qatari businesses.10 And the cost of debt moves with the Qatar Central Bank, which raised its deposit, lending, and repo rates by 25 basis points to 4.10, 4.60, and 4.35% from September 17, 2026.11 Put together, a business with a beta of 1.0 and no size or company-specific premium has a dollar cost of equity of about 10.1% on Damodaran’s inputs and about 11.3% on Kroll’s. Anything added on top of that is judgment, and it should be shown as such.
Exhibit 2
Every input to a Qatari discount rate except beta, size, and company-specific risk can be read from a published source.
Inputs to the cost of capital for a Qatari private company, October 2026, %, basis points, and multiples as stated
| Input | Value | Source and date |
|---|---|---|
| Risk-free rate (US dollar) | 5.24% ten-year; 5.65% twenty-year | US Treasury par yields, October 9, 2026 |
| Qatar sovereign spread | 55 bps five-year; 65 bps ten-year over Treasuries | Ministry of Finance $3 billion issue, September 27, 2026 |
| Mature-market equity risk premium | 4.20% (Damodaran); 5.0% recommended US premium (Kroll) | Damodaran, July 2026; Kroll, March 23, 2026 |
| Country risk premium, Qatar | 0.61% rating-based; 0.70% CDS-based | Damodaran, July 2026; Moody’s Aa2, Fitch AA |
| Industry beta, unlevered and cash-corrected | 0.45 (real estate development) to 1.11 (business and consumer services) | Damodaran emerging-market betas, January 2026 |
| Corporate income tax | 10% on profit attributable to non-Qatari, non-GCC owners; none for a company wholly owned by Qatari and resident GCC nationals | PwC Worldwide Tax Summaries, reviewed September 17, 2026 |
| Policy rates | Deposit 4.10%; lending 4.60%; repo 4.35% | Qatar Central Bank, effective September 17, 2026 |
| Cost of equity, beta 1.0, before size and company-specific premiums | About 10.1% (Damodaran inputs) to 11.3% (Kroll inputs) | Reeve Hayward arithmetic from the rows above |
Note: The two cost-of-equity figures are 5.24 + 4.20 + 0.61 and 5.65 + 5.0 + 0.61, in US dollar terms. A beta other than 1.0 scales the equity and country premiums.
Source: US Department of the Treasury; Qatar Tribune, September 27, 2026; Aswath Damodaran, NYU Stern, July 2026 and January 2026; Kroll, March 2026; PwC Worldwide Tax Summaries; The Peninsula, September 16, 2026; Reeve Hayward analysis
5.24%
Ten-year US Treasury yield on October 9, 2026, the risk-free anchor for a dollar-pegged riyal
0.61%
Qatar’s rating-based country risk premium in July 2026, the joint lowest in the GCC with the UAE
10.7×
Trailing price-to-earnings ratio of the Qatar Stock Exchange on October 11, 2026
Use listed multiples as a check, not an answer
The Qatar Stock Exchange gives a ready set of multiples. On October 11, 2026, the market traded at 10.7 times trailing earnings, 1.1 times book value, and a 4.0% dividend yield, with a capitalization of $147.9 billion after a 17.5% fall in the index since the start of the year. The spread between sectors is wide: banks at 8.9 times, insurance and telecoms at 10.2, transportation at 11.9, consumer goods and services at 14.3, industrials at 17.6, and real estate at 23.1. Across the Gulf, only Dubai is cheaper on earnings, at 8.9 times; Oman trades at 14.3, Bahrain at 15.0, Saudi Arabia at 15.5, Abu Dhabi at 16.9, and Kuwait at 18.4 (Exhibit 3).3
Exhibit 3
Listed Qatari companies trade at 10.7 times trailing earnings, below every GCC market except Dubai.
Trailing price-to-earnings ratio and dividend yield, GCC stock markets, October 11, 2026, times and %; bubble size proportional to market capitalization
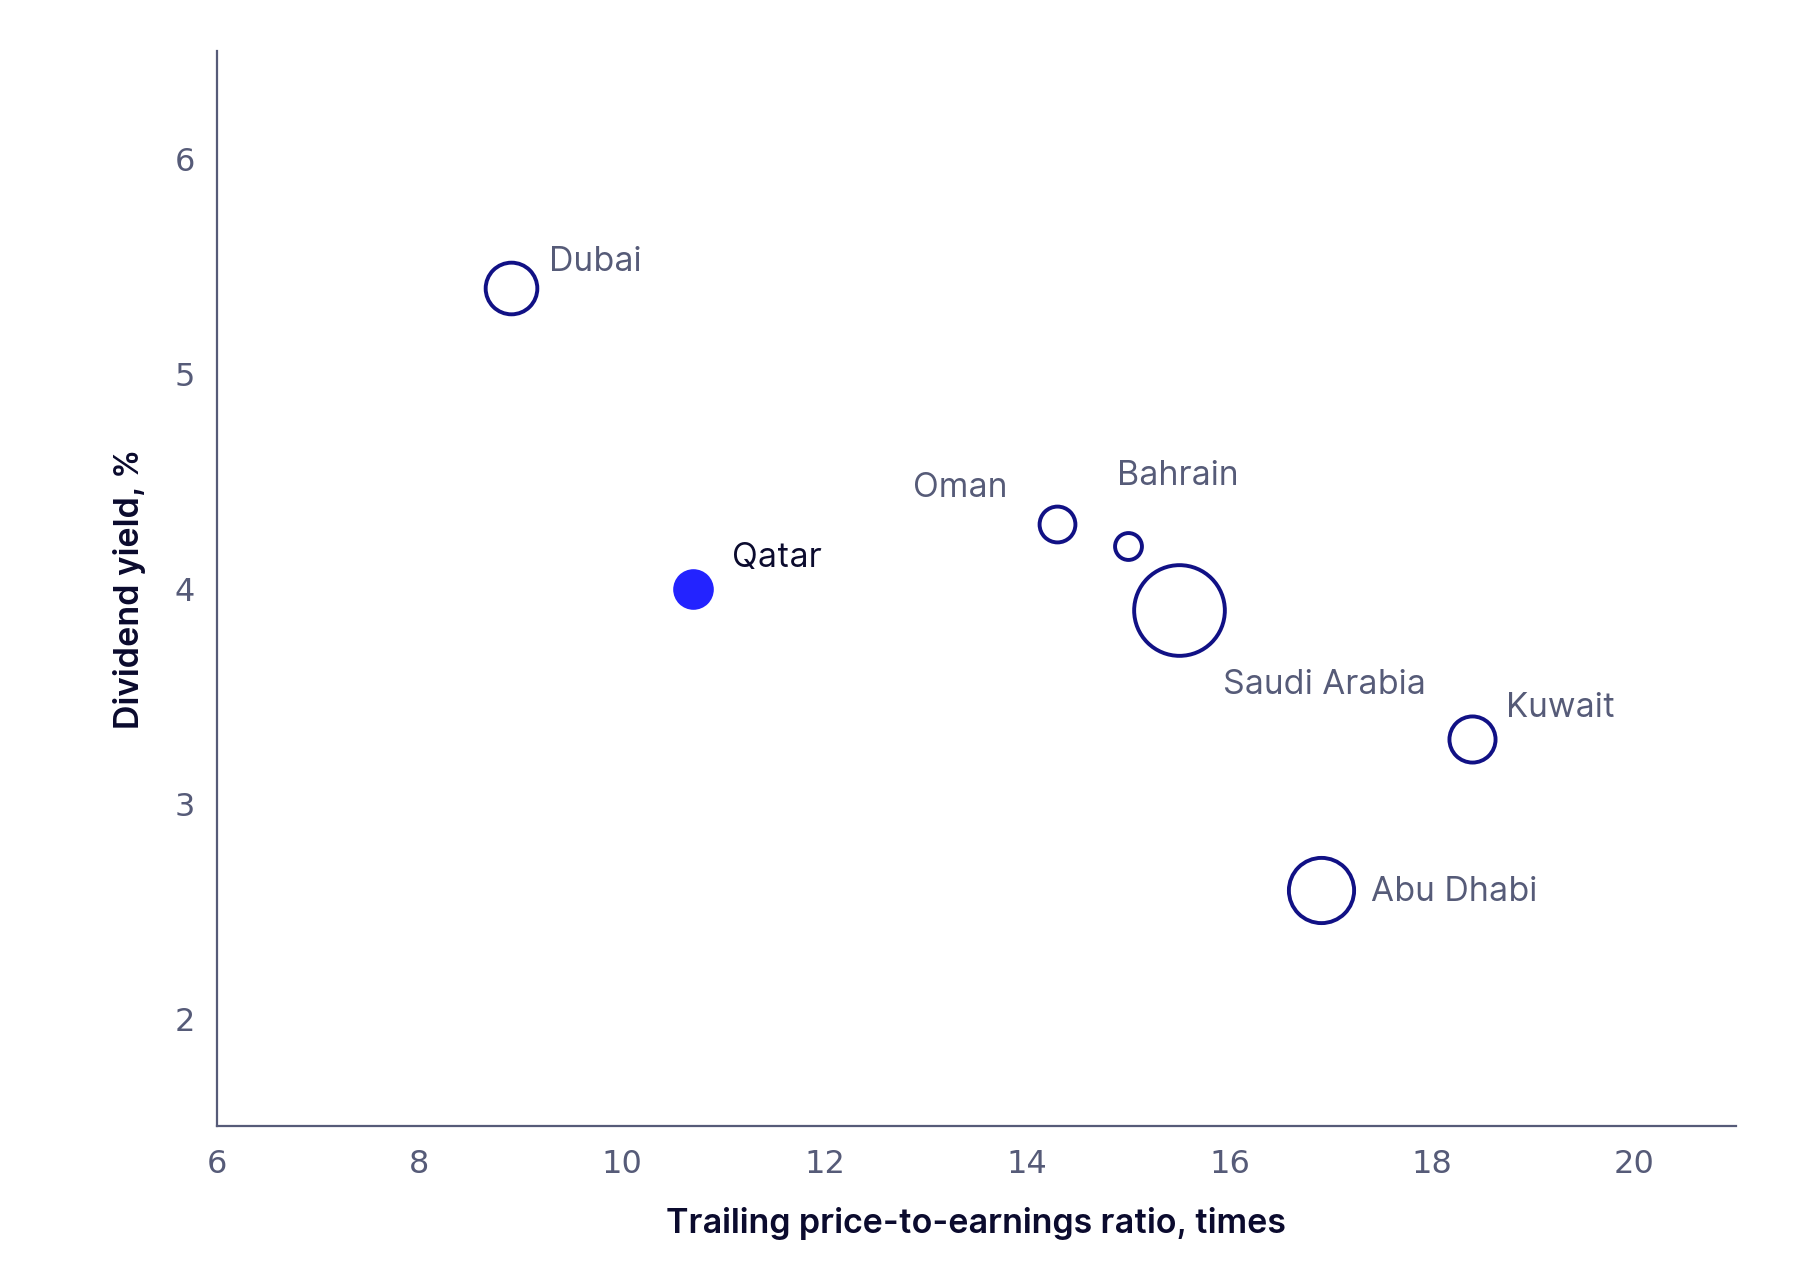
Note: Trailing twelve-month ratios. Market capitalization in $ billion: Saudi Arabia 2,487.3; Abu Dhabi 665.3; Dubai 261.5; Kuwait 166.3; Qatar 147.9; Oman 59.9; Bahrain 19.5. Dubai and Abu Dhabi data are as of October 9, 2026, the other markets as of October 11, 2026.
Source: QNB Financial Services, “Daily Market Report,” October 12, 2026, based on Bloomberg, Qatar Stock Exchange, Tadawul, Muscat Securities Market, and Dubai Financial Market data; Reeve Hayward analysis
Three cautions apply before any of these multiples is attached to a private company. A high trailing multiple may reflect depressed earnings in the base year as much as high expectations, so the comparable set should be built company by company and applied to normalized earnings. Listed prices are for small, liquid stakes; a stake in a private company is neither. And a multiple is a snapshot: a market that has fallen 17.5% since the start of the year gives a different answer in October than it did in January.3
Growth, size, and marketability: where judgment enters
Growth after the forecast period is the input that most often inflates a value, and the macro ceiling is visible. The International Monetary Fund expects Qatar’s growth to average around 4% over the medium term with inflation around 2%, so a perpetual growth rate much above 6% in nominal terms claims that the company will outgrow its economy forever.12 The near term is uneven. Qatar’s non-hydrocarbon economy grew 2.6% in the second quarter of 2026, led by real estate at 11%, financial services at 8.3%, trade at 6.9%, and construction at 5.5%, while hydrocarbon output fell 50.7% as regional conditions restricted shipping and exports.13 Fitch expects a budget surplus by 2027 and double-digit growth by 2028 as LNG capacity rises from 77 to 126 million tonnes a year.6 The forecast should carry the company’s own plan, sector by sector, with a case in which the recovery arrives a year late.
Size is the input with the weakest local evidence. The studies valuers use for a size premium, such as Kroll’s series built on US listed companies ranked by market capitalization, have no Qatari equivalent.14 A premium can still be justified, but the report has to say what it is for: thin management, customer concentration, or the absence of audited history, each of which could instead be handled in the cash flows. Control and marketability are different again. IVS 200 notes that a controlling interest may be worth more than a non-controlling one, that premiums or discounts for control depend on the method and the purpose, and that premiums paid in completed transactions apply only where the acquirer’s synergies would apply to the subject company.1 A discount for the difficulty of selling a private stake should be argued from the shareholders’ agreement, the dividend record, and the realistic exit route, not taken as a standard percentage.
Anything added on top of that is judgment, and it should be shown as such.
The practical discipline, which is the core of our business valuation work in Qatar, is to separate what can be observed from what has to be argued, and to show the reader both.
- Fix the date, the basis, and the stake before the model. A market value for a full sale, a fair value for an IFRS report, and a price for a minority partner are three different numbers from the same business.
- Work in dollars and say so. The peg makes US Treasury yields and dollar premiums the natural inputs. If the cash flows are in riyals, keep the discount rate on the same footing and state the assumption.
- Show the bridge from enterprise value to equity value. Net debt, shareholder loans, surplus property, and cash needed for working capital are where private-company valuations most often go wrong.
- Reconcile, do not average. Present the DCF, the multiples, and, where relevant, the net asset value side by side, explain the weighting, and arrive at one conclusion, as IVS requires.1
- Test the stall case. Run the plan with the recovery a year late, the discount rate a point higher, and the terminal growth a point lower. If the value only holds when all three go right, the report should say so.
Qatar is an unusually well-documented place in which to value a company. The sovereign is rated AA, its bonds price within 65 basis points of Treasuries, its country risk premium is the joint lowest in the Gulf, and its stock exchange publishes multiples every day. What those sources cannot supply is the judgment about a particular business: its growth beyond the plan, the premium for its size, and the discount for shares that are hard to sell. A good valuation takes the first set from the record and argues the second in the open.
About this article
This explainer draws on public sources checked on October 12, 2026: the International Valuation Standards effective January 31, 2025; Aswath Damodaran’s country risk tables of July 2026 and industry betas of January 2026; US Treasury yields and QNB Financial Services market data of October 2026; Kroll’s guidance of March 2026; and statements by the IMF, the National Planning Council, Fitch, and Moody’s. The cost-of-equity figures are arithmetic from those inputs for a company with a beta of 1.0, not a recommendation for any business. It is for information only and is not investment advice.
Sources
- International Valuation Standards Council, “International Valuation Standards,” effective January 31, 2025: IVS 103 Valuation Approaches, paragraphs 10.01 to 10.07 and 20.01 to 20.02; IVS 200 Businesses and Business Interests, ownership rights.
- Aswath Damodaran, NYU Stern School of Business, “Country Default Spreads and Risk Premiums,” July 2026 update (default spreads corrected July 9, 2026), sheet “ERPs by country.”
- QNB Financial Services, “Daily Market Report,” October 12, 2026, data as of October 11, 2026 (Dubai and Abu Dhabi as of October 9, 2026), based on Bloomberg, Qatar Stock Exchange, Tadawul, Muscat Securities Market, and Dubai Financial Market.
- US Department of the Treasury, “Daily Treasury Par Yield Curve Rates,” October 9, 2026.
- Qatar Tribune, “Qatar completes $3 billion dual-tranche bond issuance,” September 27, 2026.
- Qatar News Agency, “Fitch Affirms Qatar’s Credit Rating at AA Amid Outlook for Strong Economic Rebound in 2027 and 2028,” September 5, 2026.
- Arab News, “Moody’s affirms UAE at Aa2 despite forecast 7% economic contraction in 2026,” June 14, 2026 (Qatar retained at Aa2, stable).
- Kroll, “Impact of the Middle East Conflict on Cost of Capital Assumptions, March 2026 Update,” March 24, 2026.
- Aswath Damodaran, NYU Stern School of Business, “Betas by Sector (Emerging Markets),” January 5, 2026, unlevered beta corrected for cash.
- PwC, Worldwide Tax Summaries, “Qatar: Corporate taxes on corporate income,” last reviewed September 17, 2026.
- The Peninsula, “QCB increases interest rates,” September 16, 2026.
- International Monetary Fund, Press Release No. 26/041, “IMF Staff Completes 2026 Article IV Mission to Qatar,” February 12, 2026.
- Gulf Times, “Qatar’s non-hydrocarbon economy expands 2.6% in Q2 2026,” National Planning Council data via Qatar News Agency, September 30, 2026.
- Kroll, “Cost of Capital Navigator,” Valuation Insights, first quarter 2019, on the CRSP Deciles Size Study.
To discuss what this means for your business, speak with our team. Initial conversations are confidential and without obligation.
Speak with our team


