

Bank credit to Qatar’s trading companies rose 6.7% in the year to August 2026. Before borrowing more at around 5%, here is how SMEs can release cash from receivables, stock and supplier terms.
Bank lending to Qatar’s trading companies is growing steadily, as importers, distributors, and wholesalers finance their stock and the credit they extend to customers. Credit from Qatari banks to the general trade sector rose 6.7% in the year to August 2026, to QAR 216.7 billion, after 7.2% the year before. Total domestic credit held broadly steady over the same 12 months, at QAR 1,339.8 billion, so trade’s share of domestic lending rose from 15.1% to 16.2% (Exhibit 1).1, 2 That borrowing has a cost. The weighted average rate on new riyal overdrafts averaged 5.21% over the past year, and the Qatar Central Bank (QCB) raised its lending rate by 25 basis points to 4.60% from September 17, 2026.1, 3
Yet a new facility is rarely the cheapest source of working capital. For most small and medium-sized enterprises (SMEs), the cheapest cash is already on the balance sheet, in receivables, inventory, and the terms agreed with suppliers. PwC’s latest study of more than 17,000 listed companies puts the excess working capital held worldwide at €1.84 trillion and finds that smaller and mid-size firms have lost the most ground since 2015.4 This guide sets out what the bank data show, what short-term credit costs, how to measure the cash tied up in the business, and five steps to release it before borrowing more.
Exhibit 1
Bank credit to trading companies grew by QAR 13.7 billion in a year, the largest increase of any sector.
Credit facilities of banks in Qatar, five largest domestic sectors, August 2025 and August 2026, QAR billion
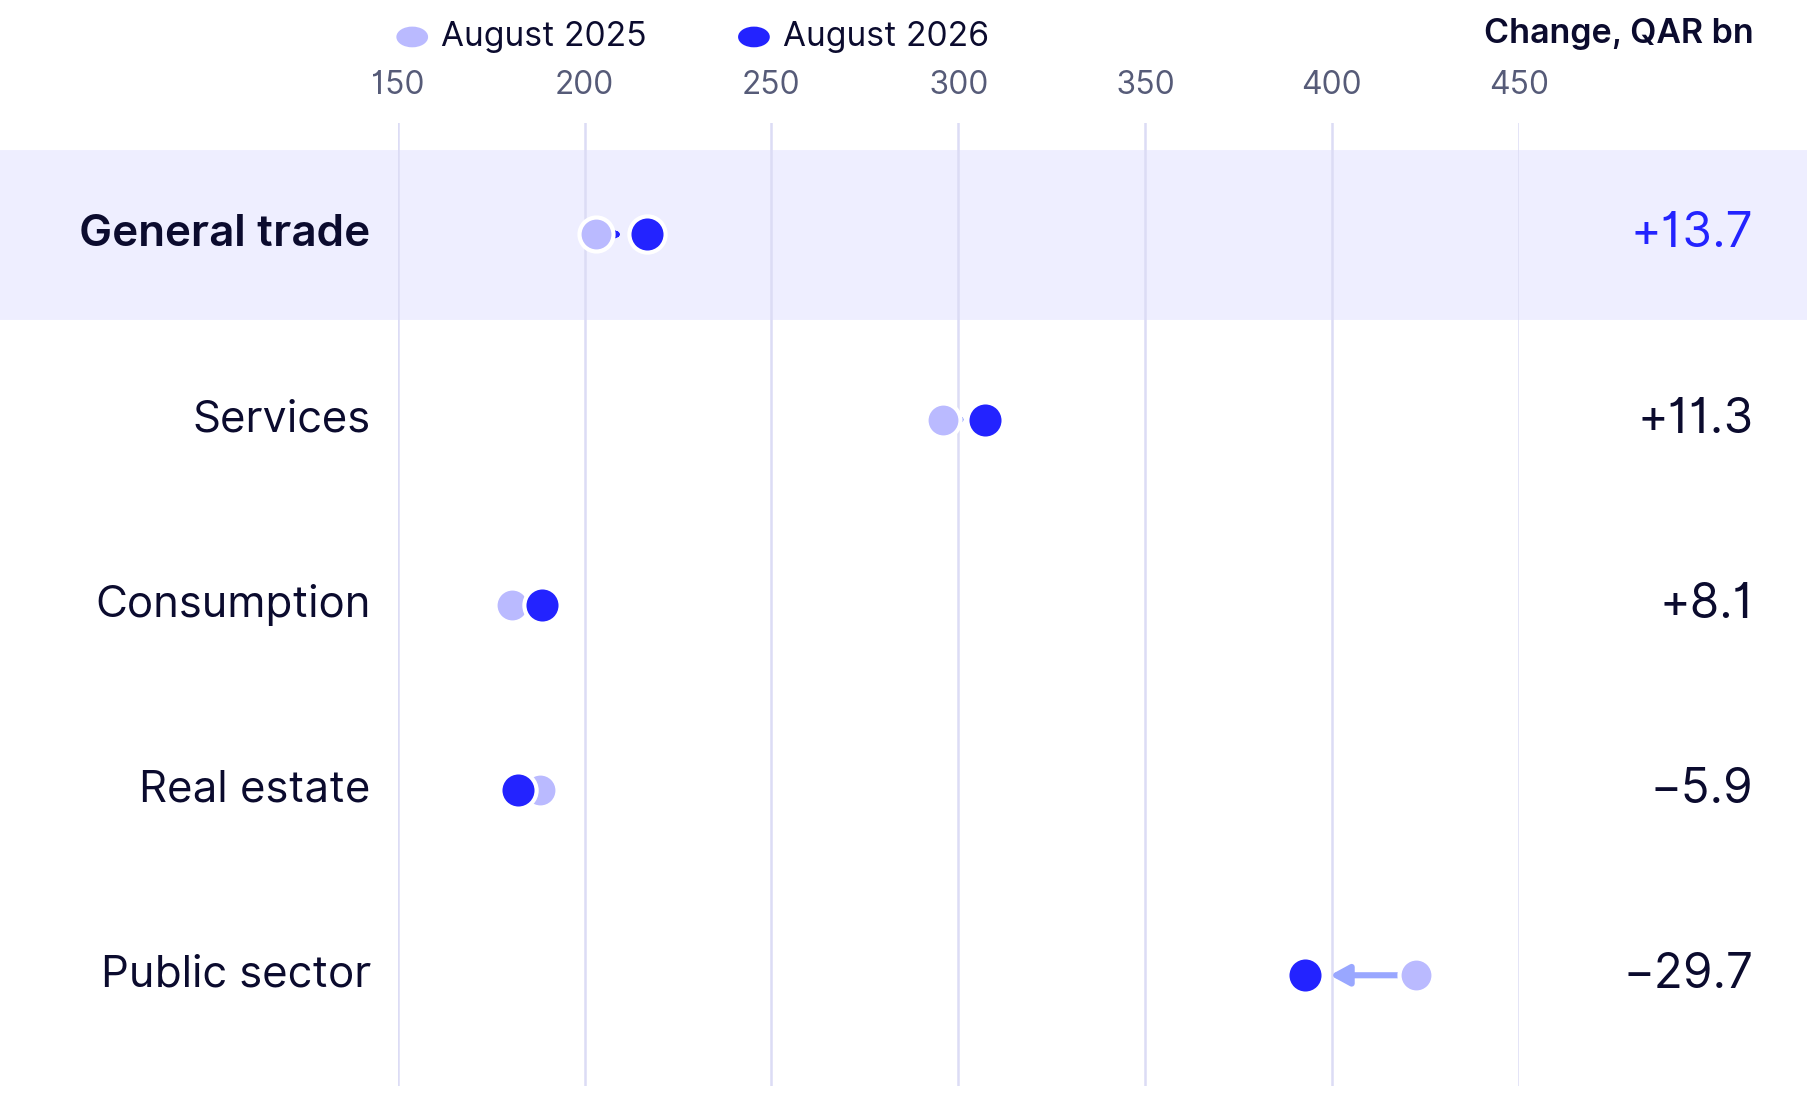
Note: End-of-month balances. The five sectors shown held 96% of domestic credit in August 2026. Not shown: contractors QAR 39.0 billion (+5.0%), industry QAR 12.2 billion (−17.8%, reflecting a one-month change of QAR 4.5 billion in June 2026), and other sectors QAR 0.8 billion. General trade credit rose QAR 8.0 billion in December 2025 alone while the “other sectors” line eased by QAR 1.6 billion, and part of that step may reflect a change in classification; the sector also grew 7.2% in the year to August 2025. Changes are calculated before rounding.
Source: Qatar Central Bank, Monthly Monetary Bulletin, August 2026, Table 17; QNB Financial Services, Qatar Monthly Key Banking Indicators, October 7, 2026; Reeve Hayward analysis
What the bank data show: Trade credit is leading growth
The QCB’s monthly statistics report bank credit by economic sector.1 For working capital, the most telling line is credit to the general trade sector, whose borrowers—importers, distributors, and wholesalers—fund mainly stock and customer credit. Over two years that line has grown 14.4%, from QAR 189.4 billion in August 2024, against 4.7% for all domestic credit. Credit to the whole private sector rose 2.7% in the year to August 2026, to QAR 946.9 billion.1
The pattern is consistent across the year rather than driven by one month. Trade credit rose 1.1% between August and November 2025 and 1.6% between December 2025 and August 2026, either side of a QAR 8.0 billion step in December, part of which may reflect a change in classification.1 The independent compilation by QNB Financial Services reports the same sector balances for August 2026 to within half a million riyals.2 For an owner, the implication is practical: trading businesses are financing more of their cycle with bank credit, so the cost of that credit deserves attention.
What short-term credit costs: 4.5% to 5.6% a year on average
QCB publishes the weighted average interest rate on new riyal credit facilities each month. Averaged over the 12 months to August 2026, overdrafts cost 5.21%, discounted bills 5.58%, and loans of under one year 4.53%, all lower than the year before (Exhibit 2).1 Monthly rates move around these averages: the overdraft rate ranged from 4.30% to 6.95% over the same period. And these figures predate the 25-basis-point rise in the QCB deposit, lending, and repo rates, to 4.10%, 4.60%, and 4.35%, that took effect on September 17, 2026.3
Exhibit 2
Overdrafts and discounted bills cost 5.2% to 5.6% on average over the past year, more than short loans.
Weighted average interest rate on new credit facilities in Qatari riyals, by facility, 12-month averages to August 2025 and August 2026, % a year
| Facility | 12 months to Aug 2025 | 12 months to Aug 2026 |
|---|---|---|
| Overdraft | 5.26 | 5.21 |
| Discounted bills | 6.84 | 5.58 |
| Loans under one year | 5.20 | 4.53 |
| Loans of one to three years | 6.60 | 6.02 |
| Loans of three years and more | 6.26 | 5.72 |
Note: Simple averages of 12 monthly weighted average rates, September to August. Monthly rates vary: the overdraft rate ranged from 4.30% to 6.95% between September 2025 and August 2026. The figures predate the 25-basis-point rise in QCB policy rates effective September 17, 2026. Working-capital facilities are highlighted.
Source: Qatar Central Bank, Monthly Monetary Bulletin, August 2026, Table 27; The Peninsula, September 16, 2026; Reeve Hayward analysis
Development finance follows the same logic. Qatar Development Bank’s Net Working Capital facility, a one-year revolving line that can be extended for a second year, finances receivables, domestic bill discounting, raw materials, inventory, and operating costs at a profit rate of 1% to 5%. It requires the business to keep minimum net working capital of 25%, measured as current assets less current liabilities in the last audited accounts, and it excludes obsolete stock and receivables.5 Any lender, in other words, starts by looking at the working capital a company already has and how well it is managed.
How to measure the cash: Three numbers and their benchmarks
Working capital comes down to three measures: days sales outstanding (DSO), days inventory outstanding (DIO), and days payables outstanding (DPO). Together they give net working capital days, the number of days of sales a company must fund itself (Exhibit 3; see sidebar “How much cash is one day worth?”). PwC’s data show the global trend moving the wrong way. DSO rose from 47.3 days in 2015 to 50.0 days in 2024. Net working capital days worsened by 13.5% for small businesses and by 19.8% for mid-size firms over the same period, while large companies held their position mainly by paying suppliers later: global DPO is up 11.5% since 2015.4 Inventory has been the heaviest drag on mid-size companies, whose DIO rose 24.2%, or 15.0 days, against 11.5% for small firms and 5.5% for large ones.4
Exhibit 3
Three ratios measure the cash tied up in working capital, and each has a published benchmark to test against.
Working-capital measures, calculation and benchmarks, listed companies worldwide and UAE survey, 2024–25, days and %
| Measure | How to calculate it | Published benchmark |
|---|---|---|
| Days sales outstanding (DSO) | Trade receivables ÷ annual sales × 365 | 50.0 days globally in 2024, up from 47.3 in 2015; average B2B payment terms of 47 days in the UAE, 2025 |
| Days inventory outstanding (DIO) | Inventory ÷ annual cost of sales × 365 | 62.8 days (UK), 68.6 (North America), and 90.2 (EU) in the most cash-intensive sectors, 2024 |
| Days payables outstanding (DPO) | Trade payables ÷ annual cost of sales × 365 | Up 11.5% globally since 2015, as large buyers paid suppliers later |
| Net working capital days | DSO + DIO − DPO | 69.2 days in the most cash-intensive sectors in 2024, against 68.3 in 2015 |
Note: Global figures cover more than 17,000 listed companies, 2015–24. “Most cash-intensive sectors” are those with net working capital days above the average. The UAE figure is from an annual survey of companies trading on credit, run in the second half of the second quarter of 2025. The UAE survey is the closest published regional benchmark.
Source: PwC, Working Capital Study 25/26; Atradius, Payment Practices Barometer, United Arab Emirates 2025; Reeve Hayward analysis
The nearest regional evidence comes from the UAE. In Atradius’s 2025 survey, half of all business-to-business (B2B) sales were made on credit, with average terms of 47 days; 58% of the value of B2B invoices was paid after its due date and 8% was written off.6 The most common reason for payment after the due date, cited by 41% of respondents, was delay in the customer’s own payment process, ahead of customers’ own cash flow at 34%. Supplier credit was the most used source of finance, by 58% of companies, ahead of bank loans at 52% and invoice financing at 35%.6
6.7%
Growth in bank credit to the general trade sector in the year to August 2026, the fastest of the five largest lending sectors
5.21%
Average rate on new riyal overdrafts over the 12 months to August 2026
50.0
Days sales outstanding across 17,000 listed companies worldwide in 2024, up from 47.3 in 2015
Five steps to release cash before borrowing
The order matters. A business that borrows first and fixes its cycle later pays interest on cash it already owns. The steps below run from measurement to financing, and most of them sit within the finance team’s control, which is how we approach cash in our strategy consulting work in Qatar.
- Measure the three numbers every month. Calculate DSO, DIO, and DPO from the management accounts, by customer and by product line, not just for the company. Averages hide the two or three customers and the slow-moving lines that hold most of the cash.
- Collect what is already owed. If administrative delay is the main reason invoices are paid late, the fixes are administrative too: invoice on delivery, quote the customer’s purchase order number, name a contact in the customer’s accounts team, and follow up on fixed days. Price any early-payment discount against the cost of the overdraft it replaces.
- Free cash from stock. Set reorder levels by product, clear lines that have not moved in a set period, and agree consignment or shorter lead times with key suppliers. Inventory days at mid-size firms worldwide rose 24.2% between 2015 and 2024, more than at small or large companies.
- Agree supplier terms rather than stretch them. Paying late is a short-term fix that strains relationships, and PwC’s data suggest large buyers have been doing it to their suppliers. Negotiate terms that match the time it takes to sell the goods, and take settlement discounts only where they beat the cost of credit.
- Then size the facility to the gap that remains. Match the instrument to the cycle: an overdraft for monthly swings, discounted bills against confirmed invoices, a short loan for a seasonal build. A lender will test the same ratios, so a company that can show them improving negotiates from strength.
A business that borrows first and fixes its cycle later pays interest on cash it already owns.
Bank credit to Qatar’s trading companies has grown by about 7% a year for two years, consistent with an active trading economy, and short-term bank credit costs around 5% a year. In that setting, every day taken out of the cash cycle releases cash a business can put to work. The companies likely to be best placed for the next year are those that know their three numbers, collect and stock with discipline, and borrow only for the gap they cannot close themselves.
About this article
The bank credit and interest rate figures are our analysis of the Qatar Central Bank’s Monthly Monetary Bulletins for August 2025, December 2025, and August 2026, cross-checked against QNB Financial Services’ compilation of the same data. Benchmarks are from PwC’s Working Capital Study 25/26 and Atradius’s 2025 survey of UAE companies; facility terms are from Qatar Development Bank’s website, read on October 20, 2026. The worked example in the sidebar is arithmetic, not data on any company. It is for information only and is not investment advice.
Sources
- Qatar Central Bank, “Monthly Monetary Bulletin,” August 2026 (with the August 2025 and December 2025 editions), Table 17 (distribution of credit facilities), Table 19 (private-sector credit facilities), and Table 27 (interest rates on credit facilities in Qatari riyals).
- QNB Financial Services, “Qatar Monthly Key Banking Indicators,” October 7, 2026, based on Qatar Central Bank data.
- The Peninsula, “QCB increases interest rates,” September 16, 2026.
- PwC, “Working Capital Study 25/26,” analysis of more than 17,000 listed companies, 2015 to 2024.
- Qatar Development Bank, “Net Working Capital,” Direct Financing, qdb.qa, accessed October 20, 2026.
- Atradius, “Payment Practices Barometer: B2B payment practices trends, United Arab Emirates 2025,” July 2025.
To discuss what this means for your business, speak with our team. Initial conversations are confidential and without obligation.
Speak with our team


