

Registered sales ran ahead of last year in the third quarter of 2026, villa prices eased slightly, land prices rose and rents held flat. This report sets out what moved, where, and how 2027 could unfold.
Qatar’s property market held its ground in the third quarter of 2026. The Ministry of Justice registered 1,808 sales worth QAR 5.6 billion between 1 July and 30 September,1 8% more by value than a year earlier.2 Villa prices eased slightly, land prices rose on the year, and rents held flat on slightly lower volumes.
That resilience came in a difficult quarter. The conflict in the region has disrupted shipping through the Strait of Hormuz, and in September the US Federal Reserve and the Qatar Central Bank (QCB) each raised interest rates by 25 basis points.3 Yet real estate activities grew 11.0% year on year in the second quarter, the fastest of any non-hydrocarbon sector,4 and registered demand stayed broad and led by households.
Our analysis suggests 2027 could bring a recovery in two steps: activity holding close to this year’s pace until export routes reopen, then strengthening in the second half as exports of liquefied natural gas (LNG) resume and the budget returns to surplus.5 The pace will be set largely outside the property market, by shipping, US interest rates and the restart of gas exports.
This report sets out what moved in the third quarter and what it could mean for 2027. It covers sales, where and what buyers bought, prices, leasing and rents, offices and shops, indicative yields, and visitors and hotels, and it closes with our view of the forces that will shape 2027. It describes the market as a whole and does not value any asset; the yields it shows are indicative only (see sidebar, “About the research”).
Sales ran ahead of last year despite the summer lull
Registered sales reached QAR 5.57 billion across 1,808 transactions between 1 July and 30 September (Exhibit 1). July recorded QAR 2.06 billion across 599 sales. August slowed to QAR 1.48 billion, as it does most summers, and September recovered to QAR 2.04 billion across 671 sales, the busiest month of the quarter. July’s total came despite four working days without registrations, from 13 to 16 July, when government offices closed for national mourning after the passing of His Highness the Father Emir, Sheikh Hamad bin Khalifa Al Thani.6 Registrations averaged about QAR 425 million a week.
Exhibit 1
Registered sales reached QAR 5.6 billion in the quarter, led throughout by villas and land.
Cumulative registered sales value by asset category, Qatar, daily, 1 July to 30 September 2026, QAR million
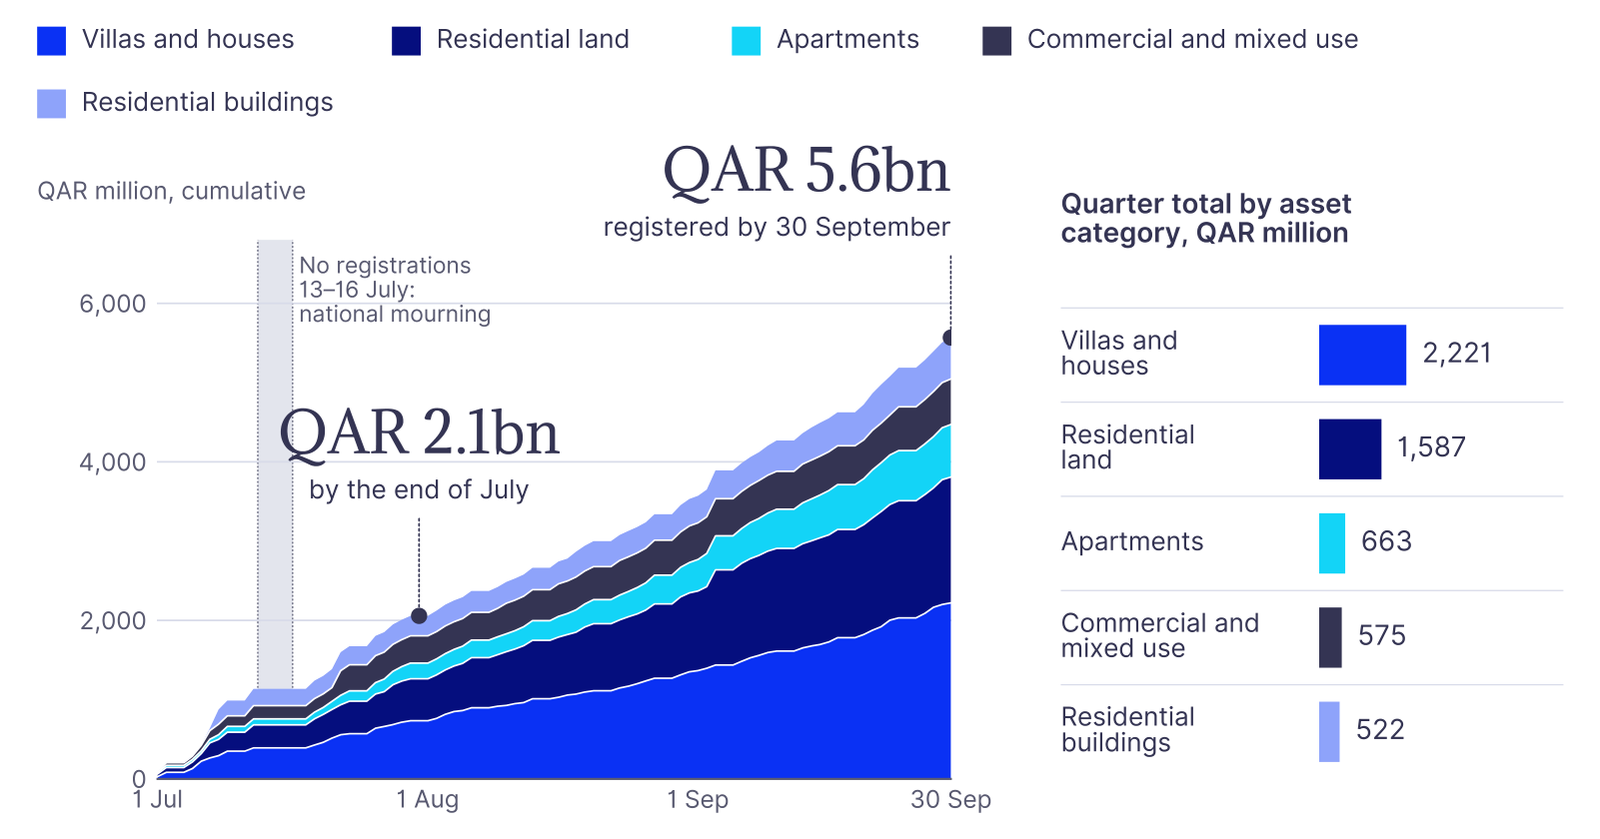
Note: Daily totals by registration date, at share value (the consideration paid); 1,808 sales. No registrations took place from 13 to 16 July, when government offices closed for national mourning after the passing of the Father Emir on 12 July. Registrations on 1 October, in the last weekly bulletin, are excluded.
Source: Ministry of Justice, open-data weekly registration files, 28 June to 1 October 2026; Reeve Hayward analysis
Against last year the comparison is favorable. Registered sales were 7.7% higher than the QAR 5.17 billion of the third quarter of 2025, and sales of land, houses and buildings 9.7% higher, at QAR 4.90 billion against QAR 4.47 billion. The gain came in July and August, which were 19.7% higher than a year earlier; September, at QAR 1.75 billion, was 5% below a strong September 2025. The quarter’s total was 9% below the QAR 6.1 billion of the second quarter, which ended before the summer break.
Where buyers bought
Doha recorded QAR 2.0 billion of sales, 36% of the quarter’s value, and Al Rayyan QAR 1.3 billion, or 24% (Exhibit 2).7 Al Daayen, home to Lusail, followed with QAR 828 million but ranked second by number of sales, with 372, because much of its activity is in smaller apartment sales. Al Wakra recorded QAR 628 million across 291 sales and Umm Slal QAR 497 million across 141.
Exhibit 2
Doha and Al Rayyan accounted for three-fifths of registered value.
Registered sales by municipality, 1 July to 30 September 2026; height = value
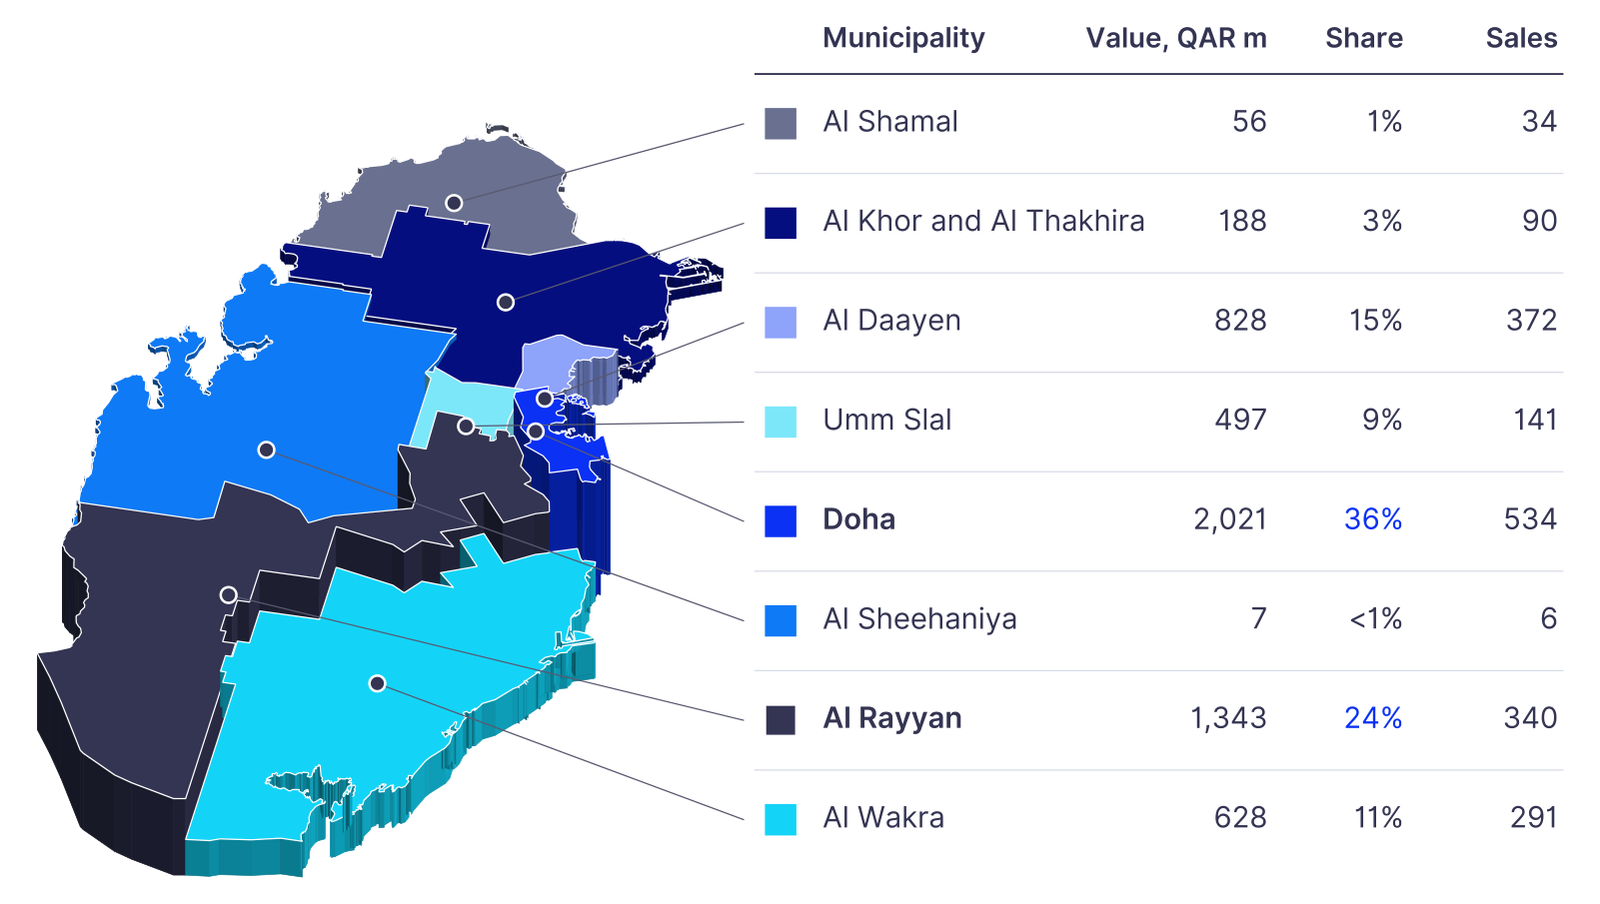
Note: Share values; shares of the quarter’s QAR 5.57 billion. Municipal boundaries from geoBoundaries (CC BY 4.0).
Source: Ministry of Justice, open-data weekly registration files, July to September 2026; Reeve Hayward analysis
The average sale was about QAR 3.8 million in Doha and QAR 3.9 million in Al Rayyan, against about QAR 2.2 million in Al Wakra and Al Daayen. The mix differed too. Villas and land made up more than three-quarters of value in Al Rayyan and 95% in Umm Slal, apartments more than a quarter in Al Daayen, and commercial property and residential buildings more than a third in Doha. Al Khor and Al Thakhira, Al Shamal and Al Sheehaniya together accounted for less than 5% of value.
Within Doha, value clustered in a handful of zones (Exhibit 3). Zone 66, which includes The Pearl and Legtaifiya, recorded QAR 429 million, about a fifth of the municipality’s total. Umm Lekhba followed with QAR 159 million, mostly residential plots, and Al Sadd with QAR 156 million, most of it from a single QAR 130 million building.
Exhibit 3
Within Doha, the zone that includes The Pearl took a fifth of registered value.
Registered sales value by zone, Doha municipality, 1 July to 30 September 2026; column height = value, five largest zones labelled
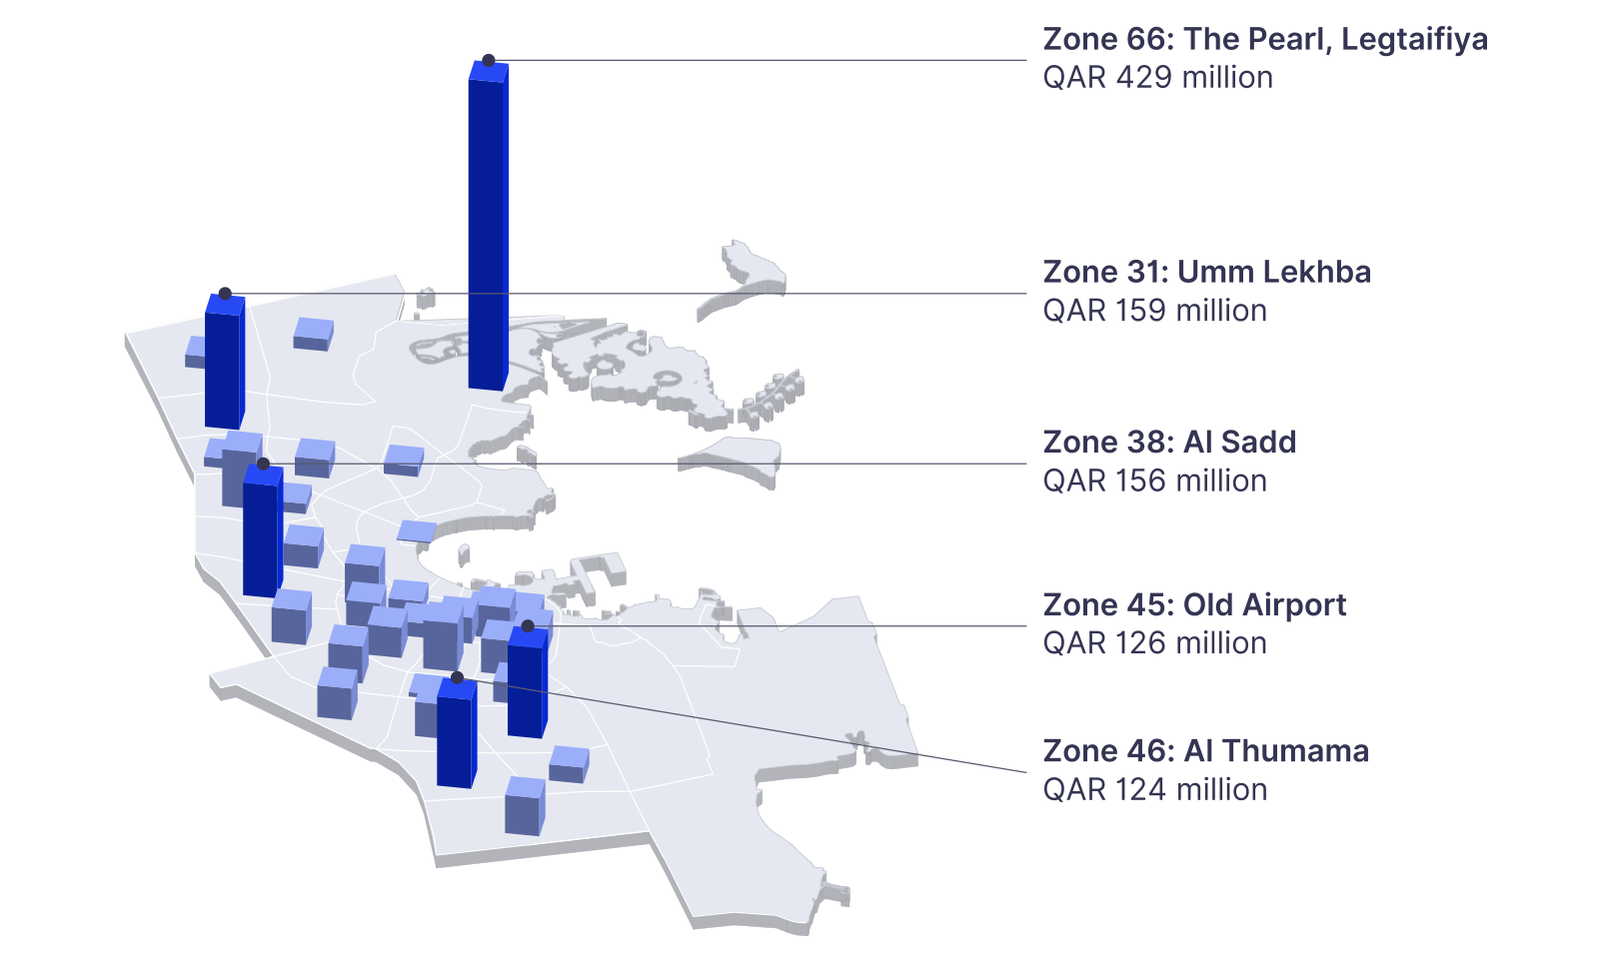
Note: Districts assigned to zones by the zone number in the ministry’s district name or, failing that, by district name; 98% of Doha’s value could be placed. Zone outlines are schematic. Lusail (zone 69) sits in Al Daayen and lies off the map.
Source: Ministry of Justice, open-data weekly registration files, July to September 2026; Reeve Hayward analysis
Old Airport recorded QAR 126 million, more than half of it in whole residential buildings, and Al Thumama QAR 124 million, all of it villas and residential plots. Together the five zones accounted for almost half of Doha’s registered value. In Al Rayyan, the zone that includes Al Waab and Al Aziziya led with QAR 489 million, followed by the zone that includes Ain Khaled and Bu Hamour with QAR 346 million.
At district level, Al Wukair in Al Wakra led by both value and number of sales, with 210 sales worth QAR 347 million at a median of QAR 1.2 million, more than half of them residential plots (Exhibit 4). The Pearl followed by value, with QAR 331 million across 114 sales, 111 of them apartments, and Lusail 69 by number, with 155 sales at a median of QAR 1.0 million, almost all of them apartments.
Exhibit 4
Al Wukair led by value and by number of sales, ahead of The Pearl and Lusail 69.
Eleven of the 12 districts with the highest registered sales value, 1 July to 30 September 2026; bubble area = value
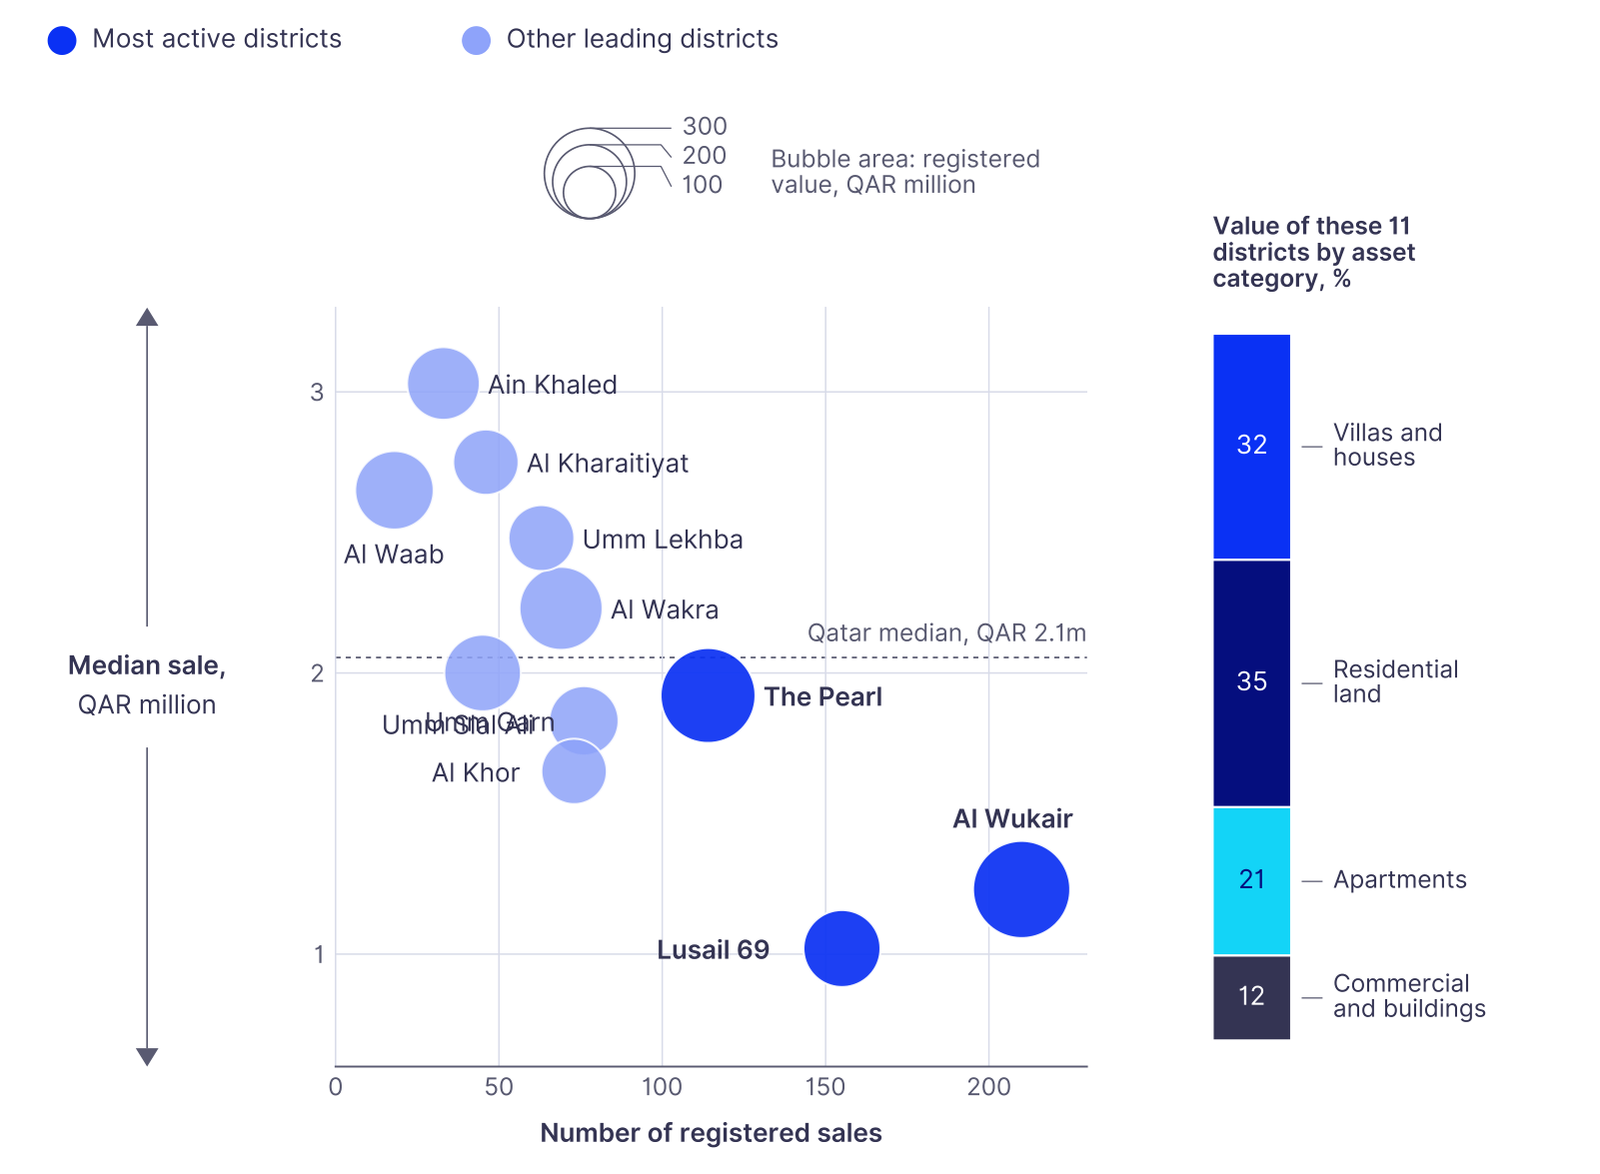
Note: District names as recorded by the ministry. Not shown: Al Sadd 38 (five sales, median QAR 9.6 million, including a QAR 130 million building).
Source: Ministry of Justice, open-data weekly registration files, July to September 2026; Reeve Hayward analysis
These three districts carried half of the leading districts’ sales but just over a third of their value. Districts with fewer but larger deals, such as Al Waab and Ain Khaled, sit at the other end of the range, with medians of about QAR 2.7 million and QAR 3.0 million. Across the 11 districts, villas and land made up two-thirds of value and apartments a fifth.
What buyers bought
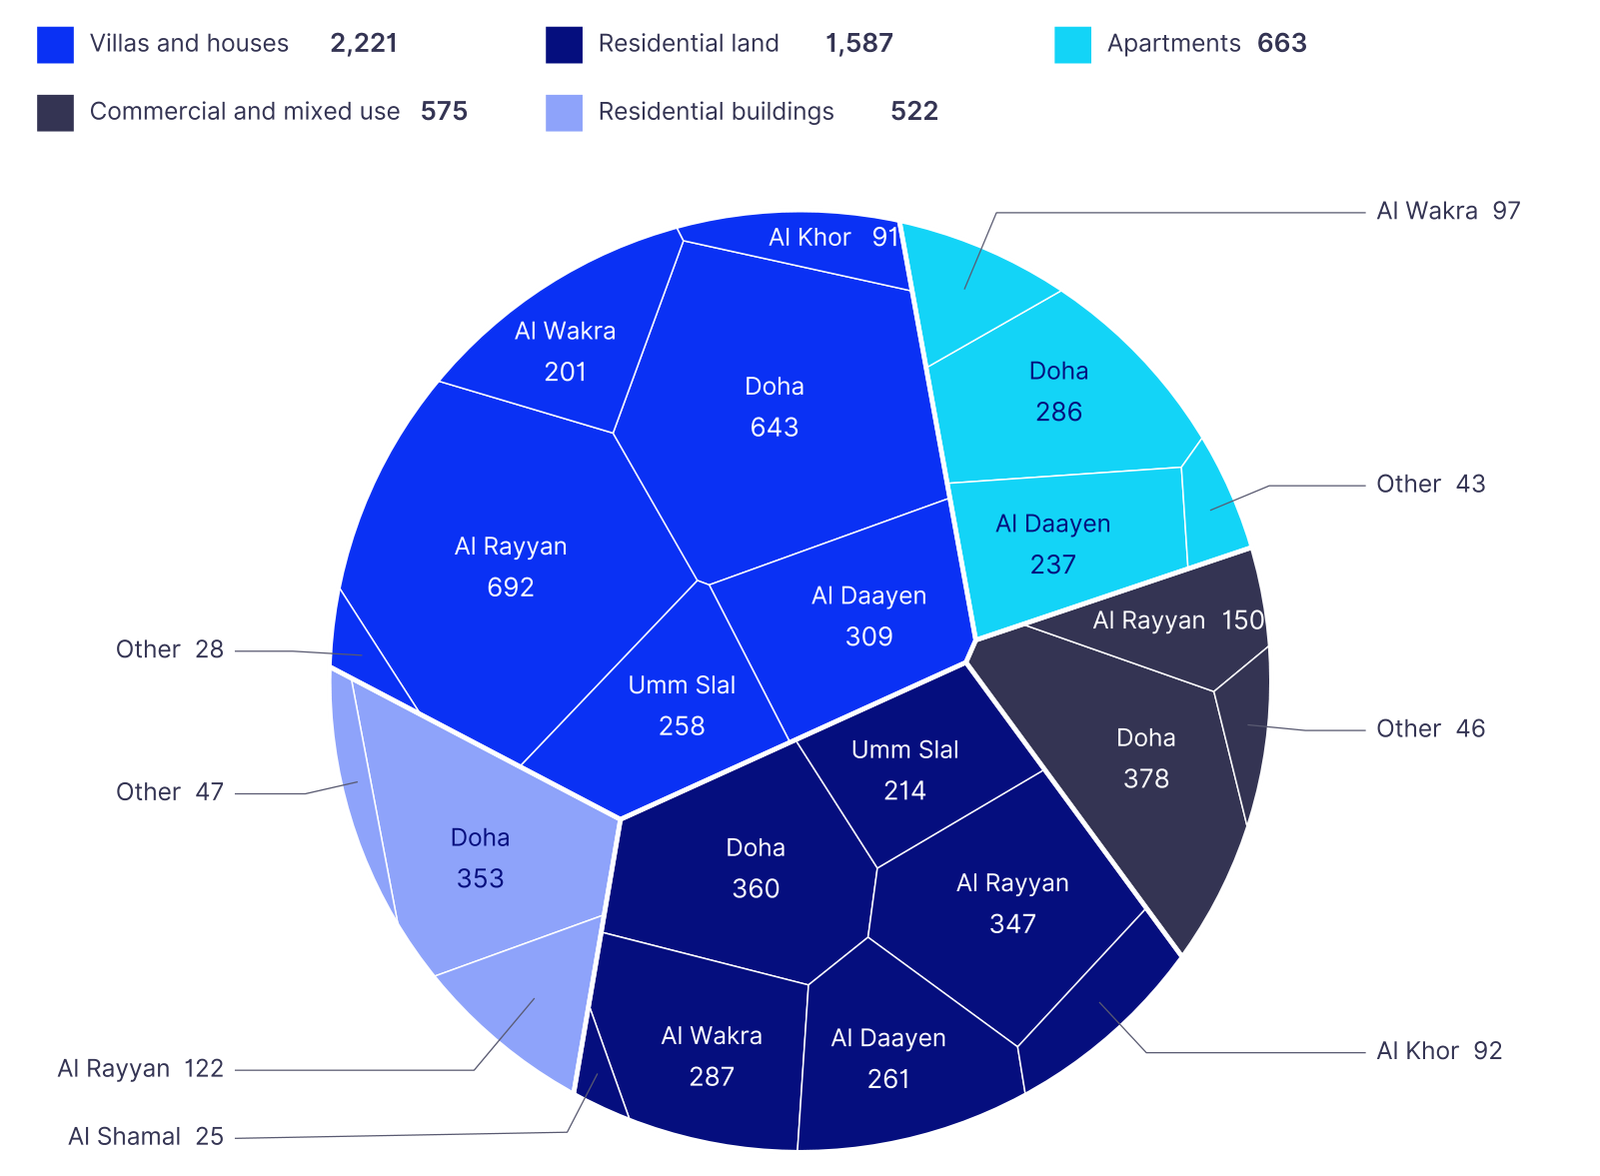
Villas and houses were the largest category, at QAR 2.2 billion across 663 sales, or 40% of value, followed by residential land at QAR 1.6 billion across 627 sales, or 29% (Exhibit 5). Apartments added QAR 663 million, commercial and mixed-use property QAR 575 million, and whole residential buildings QAR 522 million.
Exhibit 5
Villas, houses and residential land made up two-thirds of value, spread across five municipalities.
Registered sales value by asset category and municipality, 1 July to 30 September 2026; QAR million, cell area = value
Note: Share values. Categories group the ministry’s property-type and zoning fields. Other: municipalities with less than QAR 50 million in the category, pooled (villas: Al Shamal, Al Sheehaniya; apartments: Al Rayyan, Umm Slal; commercial: Al Daayen, Umm Slal, Al Shamal, Al Khor; buildings: Al Wakra, Al Khor).
Source: Ministry of Justice, open-data weekly registration files, July to September 2026; Reeve Hayward analysis
Villa sales were led by Al Rayyan and Doha, at QAR 692 million and QAR 643 million, while land sales spread across five municipalities. Apartments were concentrated in Doha and Al Daayen, which together took 79% of apartment value, mostly on The Pearl and in Lusail. Doha also took about two-thirds of the value of both commercial property and residential buildings.
Commercial and mixed-use property changed hands in 59 registered sales worth QAR 575 million, 40 of them in Doha, led by whole buildings in established districts such as Al Sadd, Fereej Bin Mahmoud and Al Aziziya.
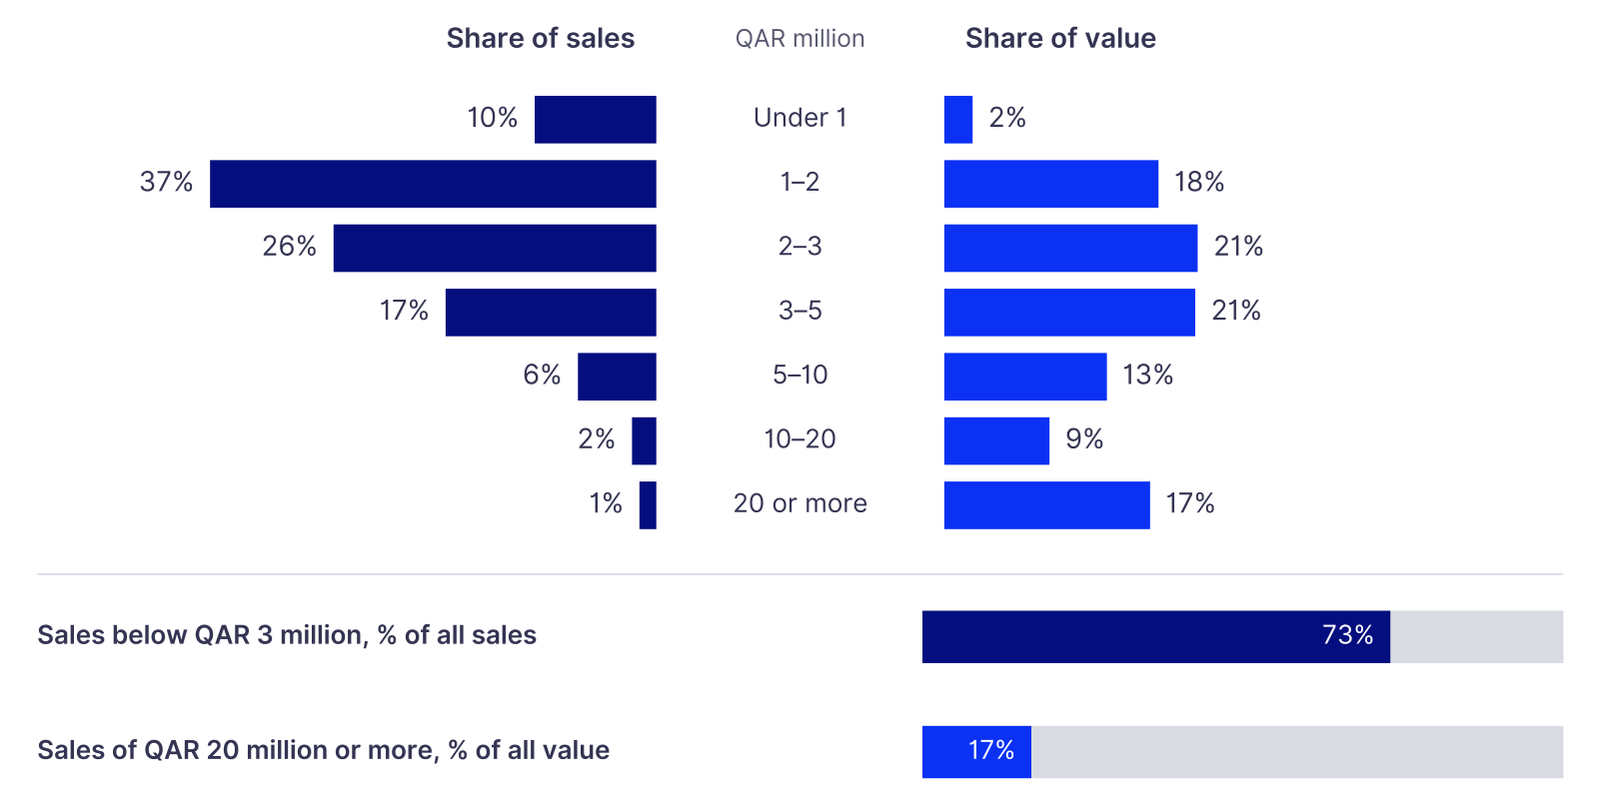
Most of the market’s depth lies in mid-sized deals. The median sale was QAR 2.1 million, and 73% of sales were below QAR 3 million (Exhibit 6). At the other end, 25 sales of QAR 20 million or more carried 17% of value, led by the Al Sadd building, a QAR 122 million residential complex in Al Waab and a QAR 73 million plot in Umm Slal Ali.
Exhibit 6
Nearly three in four sales were below QAR 3 million, but sales of QAR 20 million or more carried a sixth of value.
Registered sales by deal size, 1 July to 30 September 2026, % of sales and % of value
Note: Share values; deal-size bands in QAR million.
Source: Ministry of Justice, open-data weekly registration files, July to September 2026; Reeve Hayward analysis
Median sale sizes by category tell the same story: QAR 2.7 million for villas, QAR 1.9 million for residential land and QAR 1.4 million for apartments, against QAR 5.1 million for commercial property and QAR 5.9 million for residential buildings. A market led by households in this way may be less sensitive to rising rates than one driven by leveraged investors, which may help explain why volumes held up as financing costs rose.
Villa prices eased slightly while land prices rose
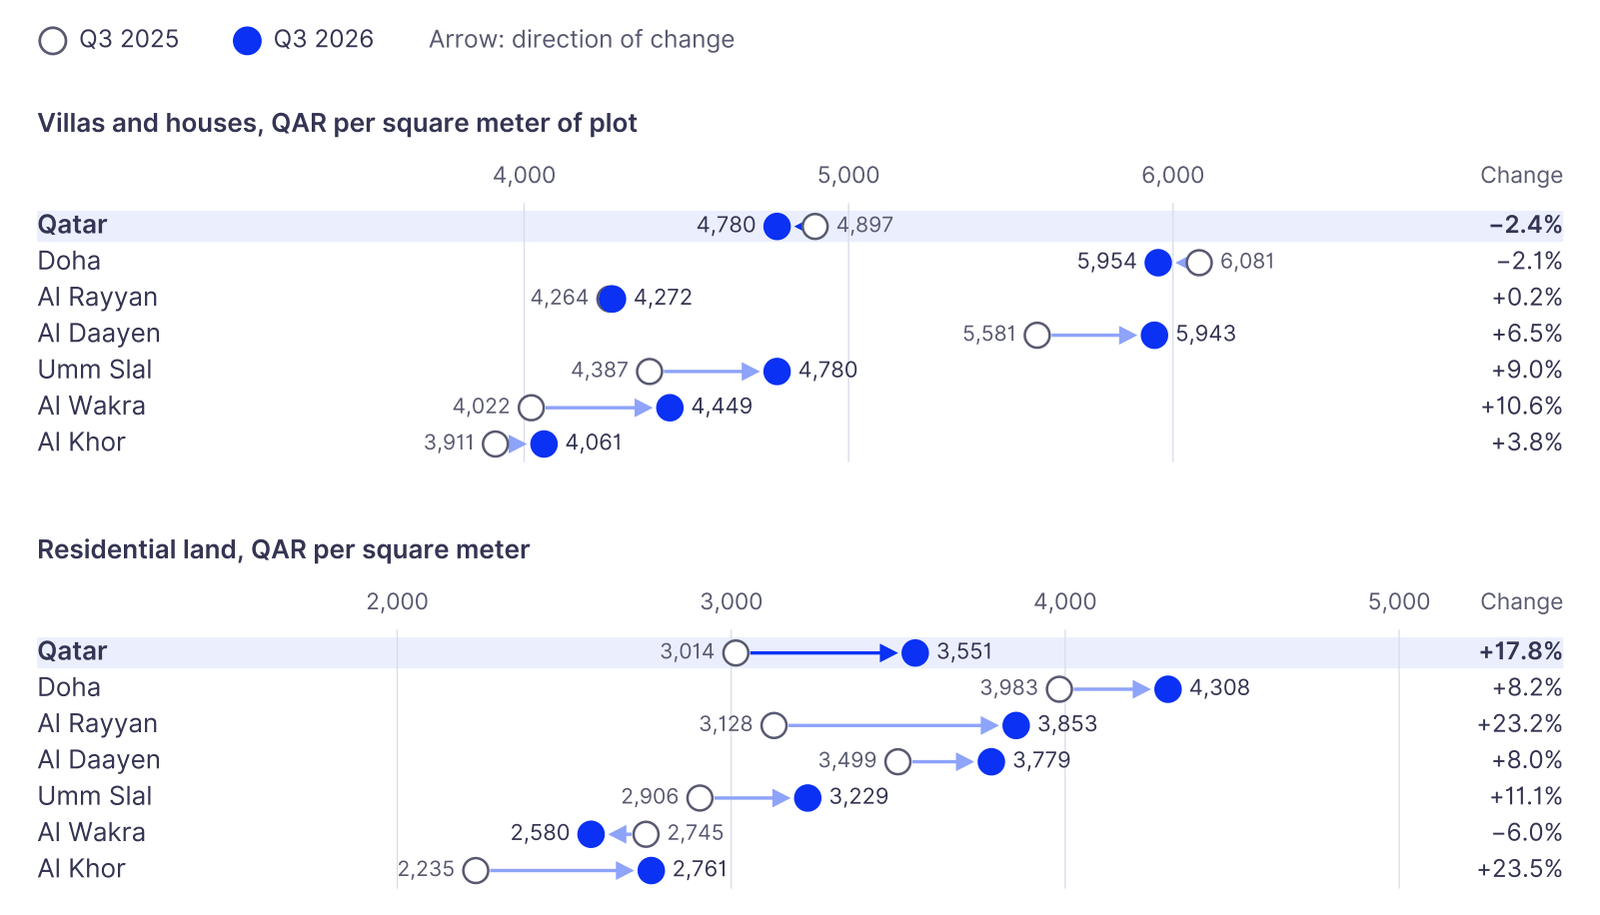
Registered prices per square meter rose on the year in most municipalities (Exhibit 7). In the Ministry of Justice register the median villa sold for QAR 4,780 per square meter of plot, 2% less than a year earlier and 3% less than in the second quarter. The median rose in five of the six main municipalities, so the national dip partly reflects the mix of villas sold; Doha was the exception, 2% lower. Residential land sold for a median of QAR 3,551 per square meter, up 18% on the year and 10% on the quarter.8
Exhibit 7
Prices per square meter rose over the year in most municipalities; Doha villas and Al Wakra land were the exceptions.
Median registered price per square meter, villas and houses (above) and residential land (below), third quarter 2025 and 2026, QAR
Note: Medians of share value divided by share area across all registered sales, sensitive to the mix of properties sold. Sales behind the Qatar medians, 2026 (2025): villas 663 (672), land 627 (498); Al Khor and Al Thakhira land rests on 25 sales in 2025. Al Shamal and Al Sheehaniya are not shown.
Source: Ministry of Justice, open-data weekly registration files, July to September 2025 and 2026; Reeve Hayward analysis
Villa prices rose 11% in Al Wakra, 9% in Umm Slal, 6% in Al Daayen and 4% in Al Khor, held level in Al Rayyan and slipped 2% in Doha. Land prices rose by almost a quarter in Al Rayyan and Al Khor, 11% in Umm Slal and 8% in Doha and Al Daayen, but fell 6% in Al Wakra. The QCB’s real estate price index eased 0.7% in August, to 241.4.9 With volumes holding up, the dip in villa prices looks more like a market digesting earlier gains than the start of a correction.
Apartments diverged. On The Pearl the median apartment sold for QAR 13,546 per square meter, 5% more than a year earlier, and the median rent held at QAR 10,000 a month. In Lusail 69 the median fell 18%, to QAR 10,290, and the median rent was 8% lower, at QAR 6,750.10 A year ago the two districts sold at almost the same price per square meter; Lusail 69 is now about a quarter cheaper. Larger units in this quarter’s sales, a median of 92 square meters against 85, may explain part of the gap, but softer rents point to a district still absorbing recent supply.
Leasing slowed while rents held
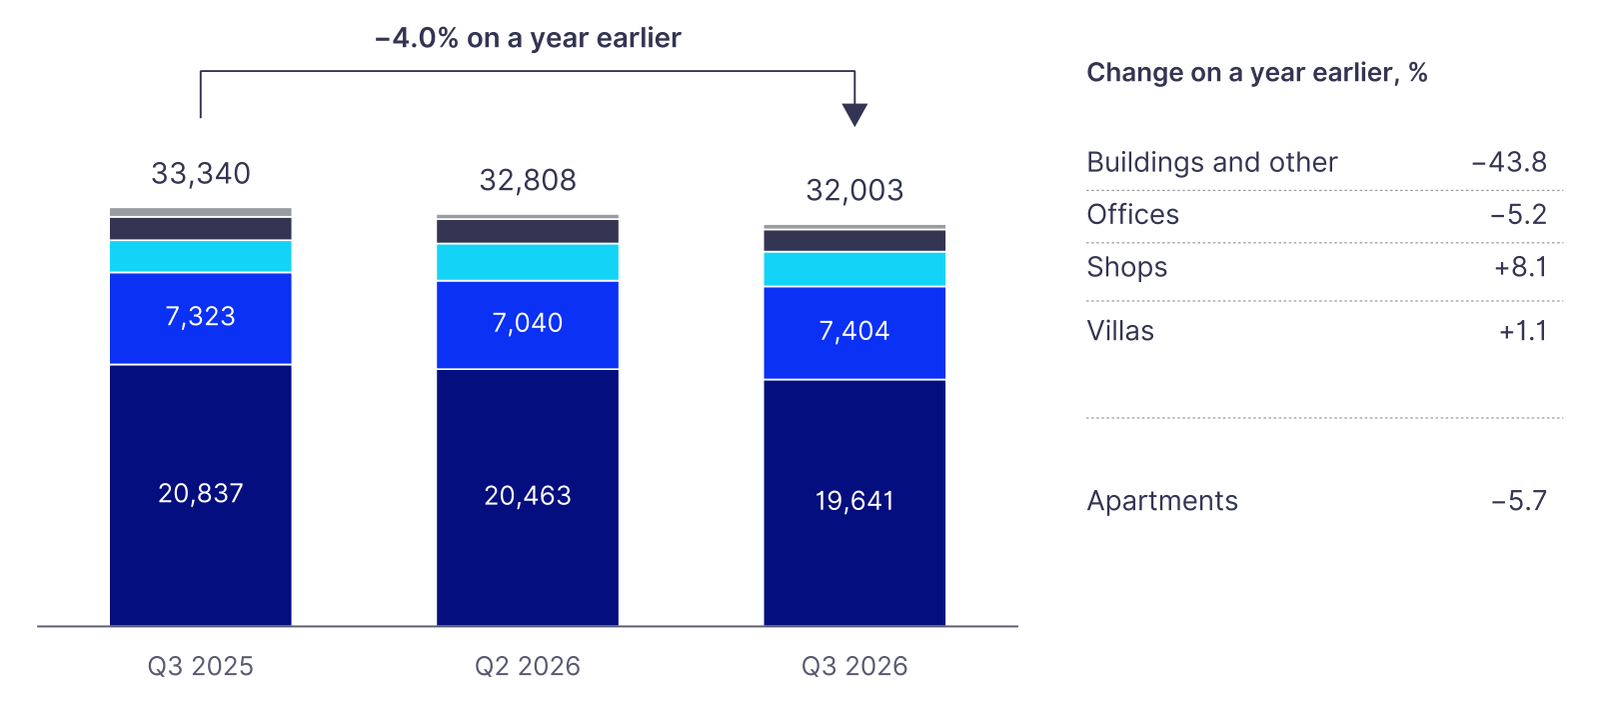
Aqarat registered 32,003 lease contracts in the third quarter, 2.5% fewer than in the second quarter and 4.0% fewer than a year earlier (Exhibit 8).11 Apartments accounted for 61% of contracts and villas for 23%; shops and offices together made up 14%.
Exhibit 8
Registered leases fell 4% on a year earlier, as fewer apartments and offices were let.
Registered lease contracts by property type, Qatar, number of contracts
Note: Contracts by registration date. Buildings and other include whole buildings, residential and commercial complexes, administrative buildings and towers.
Source: Real Estate Regulatory Authority (Aqarat), Qatar Real Estate Platform, rental indicators, accessed 7 October 2026; Reeve Hayward analysis
Apartment leases fell 5.7% on the year and office leases 5.2%, while villa leases rose 1.1% and shop leases 8.1%. By location, leasing fell 6% in Doha and Al Wakra and 4% in Al Rayyan but rose 8% in Al Daayen and Umm Slal. Renewals were level with a year earlier, at about 5,300 contracts or 16.5% of the total, so the fall came almost entirely from new lettings.
The shortfall opened up in September (Exhibit 9). July ran slightly below last year and August was busier for every property type, but September fell short of last year’s back-to-school surge.
Exhibit 9
August leasing ran ahead of last year for every property type; September fell short.
Registered lease contracts by month and property type, July to September 2026 and 2025, number of contracts
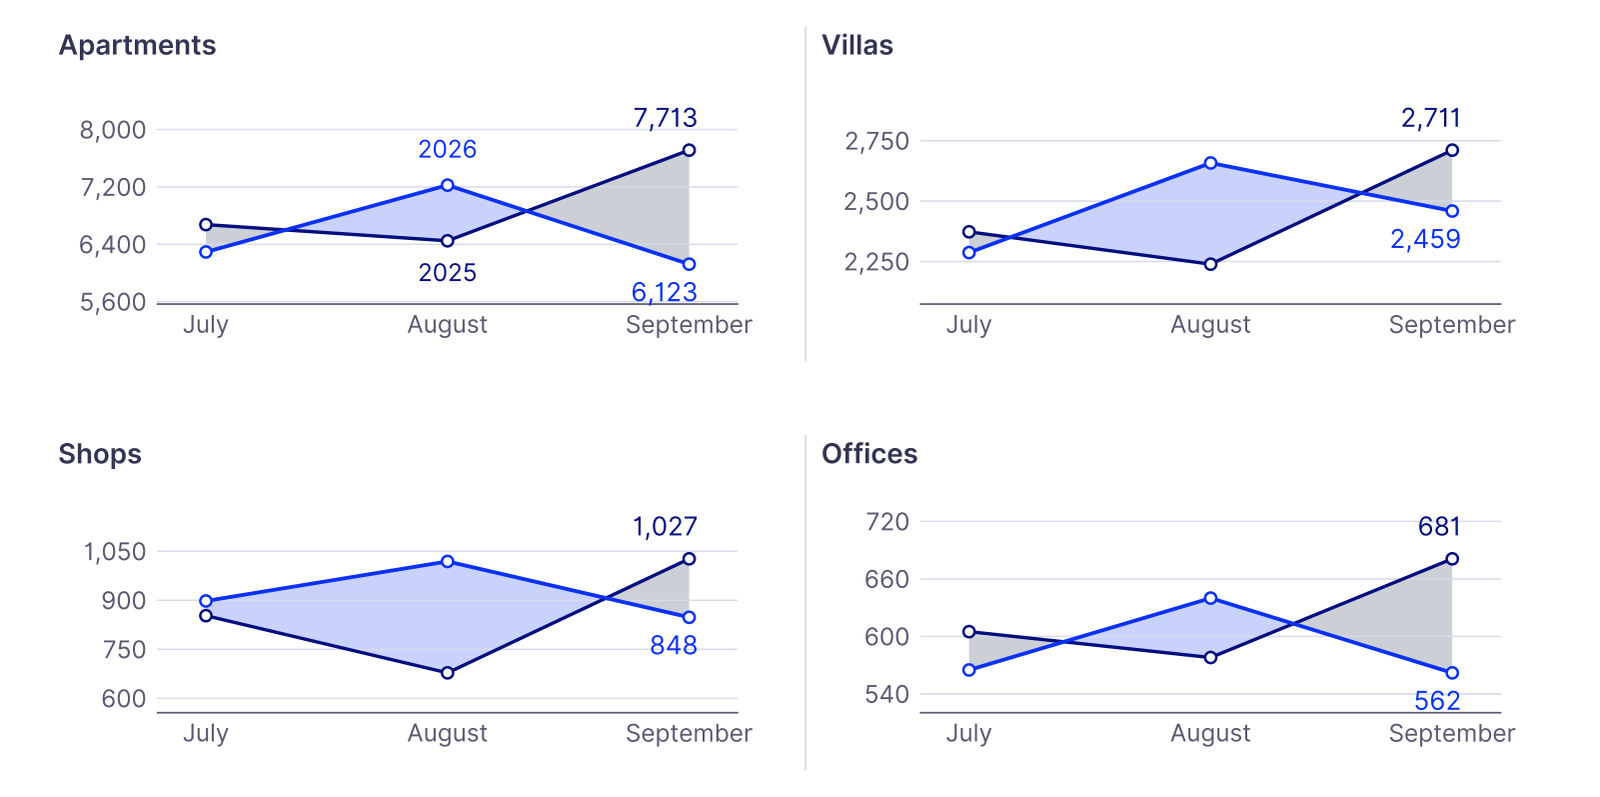
Note: Contracts by registration date; vertical scales differ by panel.
Source: Real Estate Regulatory Authority (Aqarat), Qatar Real Estate Platform, rental indicators, accessed 7 October 2026; Reeve Hayward analysis
Apartment contracts in September were 21% below September 2025, villa contracts 9%, and shop and office contracts 17%. A single month is a thin basis for judgment, but the pattern points to softer demand from new tenants after the summer.
Median rents were unchanged nationally, at QAR 4,500 a month for apartments and QAR 10,000 for villas, the same as a year earlier (Exhibit 10). Flat medians alongside lower volumes may suggest that landlords are holding rents and accepting slower lettings.
Exhibit 10
Rents were flat nationally but rose for villas in Doha and Al Daayen and fell for shops almost everywhere.
Median registered monthly rent, third quarter 2026, QAR; change on the second quarter of 2026, %
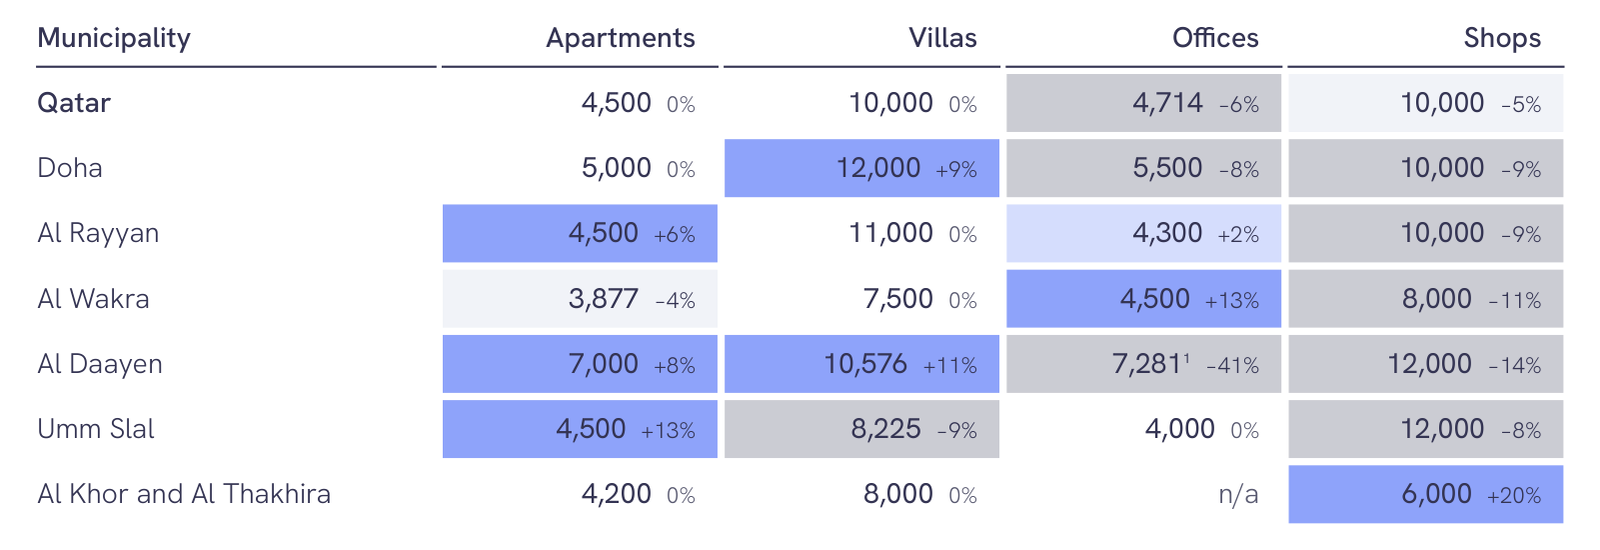
Note: Shading shows the change on the second quarter: darker blue, up 5% or more; light blue, up 0.5–5%; white, little changed; light grey, down 0.5–5%; darker grey, down 5% or more. Medians of all registered contracts, unadjusted for unit size, furnishing or lease term; n/a = fewer than 40 contracts. ¹ Not like for like: the second-quarter median was lifted by bulk leasing of large floorplates in Lusail.
Source: Real Estate Regulatory Authority (Aqarat), Qatar Real Estate Platform, rental indicators, accessed 7 October 2026; Reeve Hayward analysis
Villa rents rose 9% on the quarter in Doha, to QAR 12,000 a month, and 11% in Al Daayen, while Umm Slal fell 9%. Apartment rents rose 8% in Al Daayen and 6% in Al Rayyan but eased 4% in Al Wakra, where affordable stock is plentiful.
Unit size predicts rent less well than location (Exhibit 11). Where the register records bedrooms, the median one-bedroom apartment let for QAR 5,200 a month nationally, more than the median two-bedroom at QAR 4,300, because one-bedroom units are concentrated in the freehold districts, where rents are highest. Within a single district the expected gradient reappears: on The Pearl, median rents rise from QAR 8,000 for one bedroom to QAR 11,000 for two and QAR 13,500 for three.
Exhibit 11
Two in five one-bedroom lettings are in the two main freehold districts, against one in ten two-bedroom lettings.
Share of apartment lettings on The Pearl or in Lusail’s zone 69, by number of bedrooms, third quarter 2026, %

Note: Apartment leases with a recorded bedroom count; the field is blank for 44% of contracts. Zone 69 comprises Lusail 69, Al Kharayej and Jabal Thuaileb.
Source: Real Estate Regulatory Authority (Aqarat), Qatar Real Estate Platform, rental indicators, accessed 7 October 2026; Reeve Hayward analysis
Offices and shops
Registered office leasing fell to 1,767 contracts, 9% fewer than in the second quarter, and the median rent eased 6%, to about QAR 4,700 a month; it fell 8% in Doha but edged up 2% in Al Rayyan. Shop leasing held up better, at 2,765 contracts, 8% more than a year earlier, though the median rent slipped 5% on the quarter, to QAR 10,000.
Indicative yields: A range rather than a price
Gross yields here divide the annual median rent registered with Aqarat by the median sale price registered with the Ministry of Justice. The two registers are not matched to the same units, and none of the sources records condition, service charges or vacancy consistently. Aqarat’s lease records carry no usable unit size. Online listings do state a size, but it is not reliable: the unit actually let or sold is sometimes different from the one listed. The figures in Exhibit 12 are therefore indicative only and are not good enough to be relied upon for investment or valuation decisions; they describe the market and do not price any asset.
Exhibit 12
Registered data point to higher gross yields than asking terms in five of eight segments.
Gross yield (annual median rent ÷ median price) by segment, third quarter 2026, %, indicative only
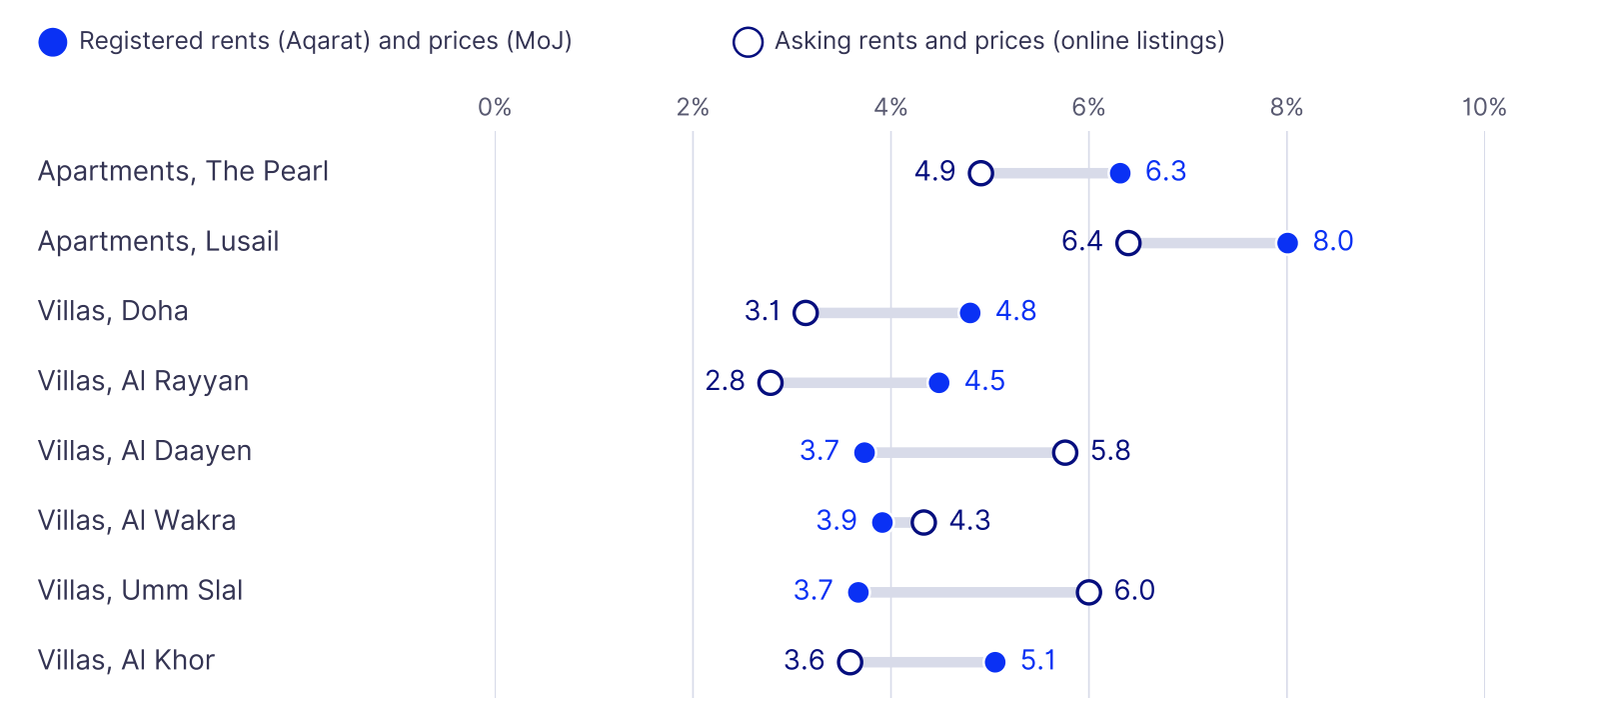
Note: Gross yields before service charges, maintenance, vacancy and management costs; not to be relied upon for investment or valuation decisions. Registered: Aqarat leases and Ministry of Justice sales at share value (villas: whole-property sales). Online listings: 10,914 rental and 10,009 sale listings. Registered Lusail is zone 69; listed Lusail is the whole city.
Source: Aqarat (rents); Ministry of Justice (prices); various online listings, 6–7 October 2026; Reeve Hayward analysis
On registered evidence, villas yield about 3.7 to 5.1% gross, and apartments in the two main freehold markets more: about 6.3% on The Pearl and 8.0% in Lusail’s zone 69. Apartments earn more rent per riyal of capital than villas, partly because a villa’s price includes a large plot that its rent does not fully reflect.
Asking terms in online listings point lower in five of the eight segments, and the gap comes mainly from prices (Exhibit 13).12 Asking prices for villas in Doha and Al Rayyan are about 2.2 and 1.8 times the registered medians, because listings lean toward newer and larger homes, while asking rents are only 9 to 42% higher.
Exhibit 13
Asking prices for villas run at more than twice registered prices in Doha and Al Khor.
Median registered price (Ministry of Justice) and median asking price (online listings), by segment, third quarter 2026, QAR million; badge = asking ÷ registered
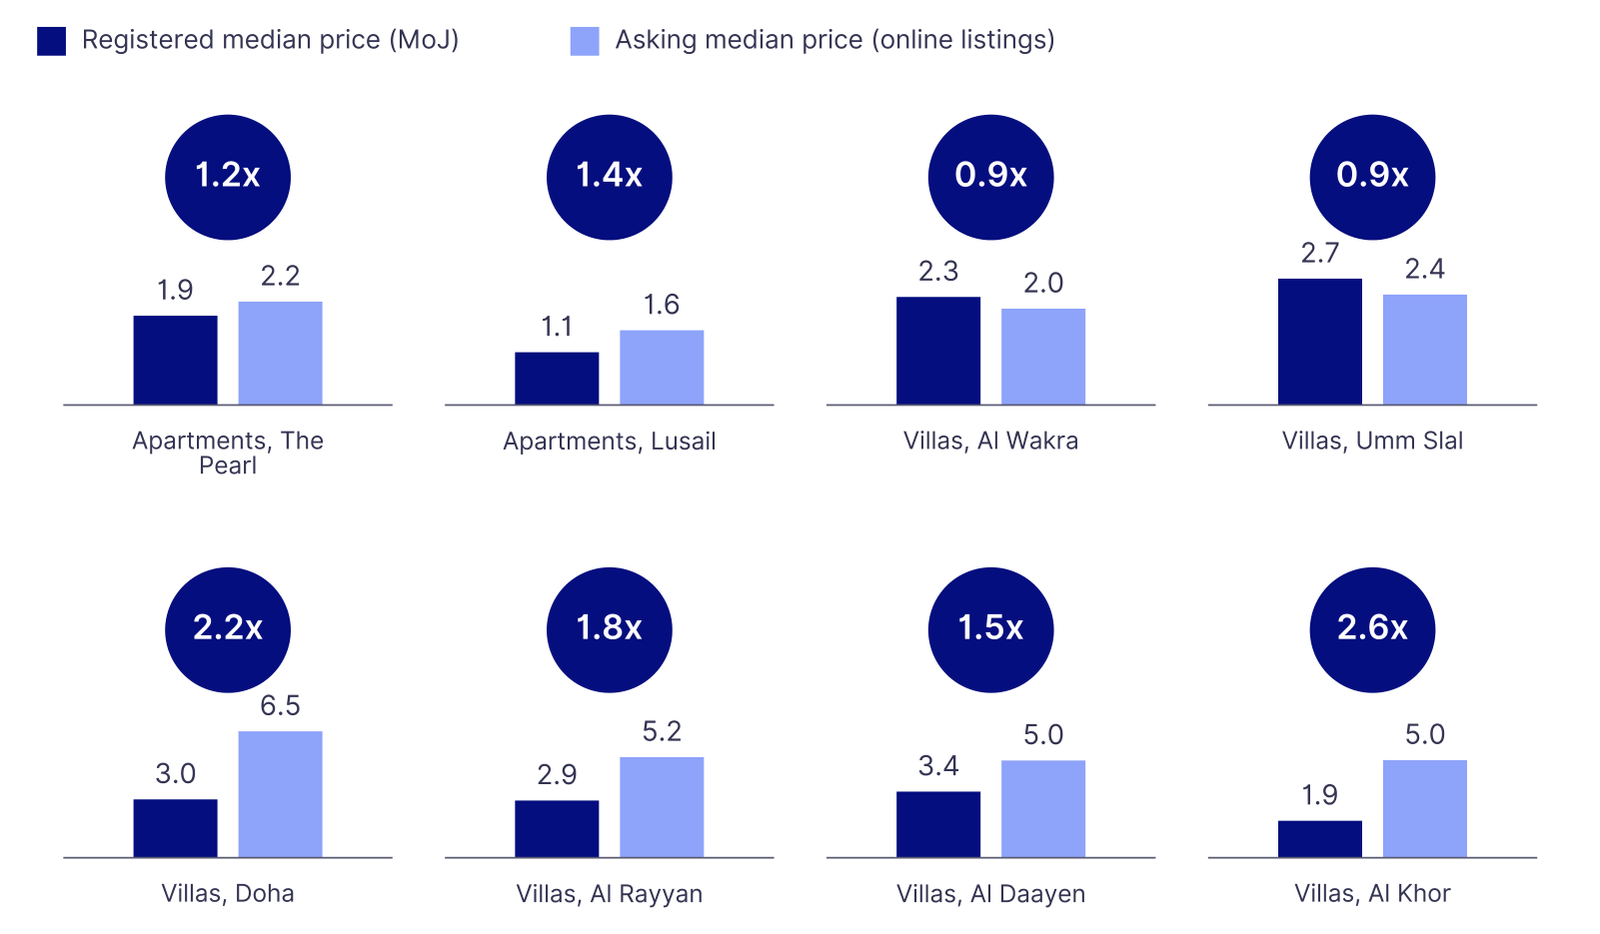
Note: Registered villa prices are medians of whole-property sales at share value, plot included. Registered Lusail covers zone 69 (Lusail 69, Al Kharayej and Ghar Thuaileb); listed Lusail covers the whole city.
Source: Ministry of Justice, open-data weekly registration files; various online listings captured 6–7 October 2026; Reeve Hayward analysis
Where listed and transacted stock look more alike, as for villas in Al Wakra, the two measures sit close together, at 3.9 and 4.3%. In Al Daayen and Umm Slal the opposite happens: listed rentals lean toward newer and larger villas, including Lusail’s waterfront homes, so asking rents run 43 to 127% above registered rents and asking yields come out higher.
Matched by number of bedrooms, with registered prices per square meter applied to the sizes stated in the listings, the two sources agree more closely, though the listed sizes are only a guide. On The Pearl, registered and asking yields for one- to three-bedroom apartments fall within 4.8 to 6.3%, and in Lusail’s zone 69 within 4.8 to 7.2%. Gross yields also overstate what an owner keeps: after service charges, maintenance, vacancy and management, net yields could be a quarter to two-fifths lower. Until the lease register records unit size consistently, any yield for Qatar is best read as a range.
Until the lease register records unit size consistently, any yield for Qatar is best read as a range.
Visitors steadied and hotel occupancy recovered over the summer
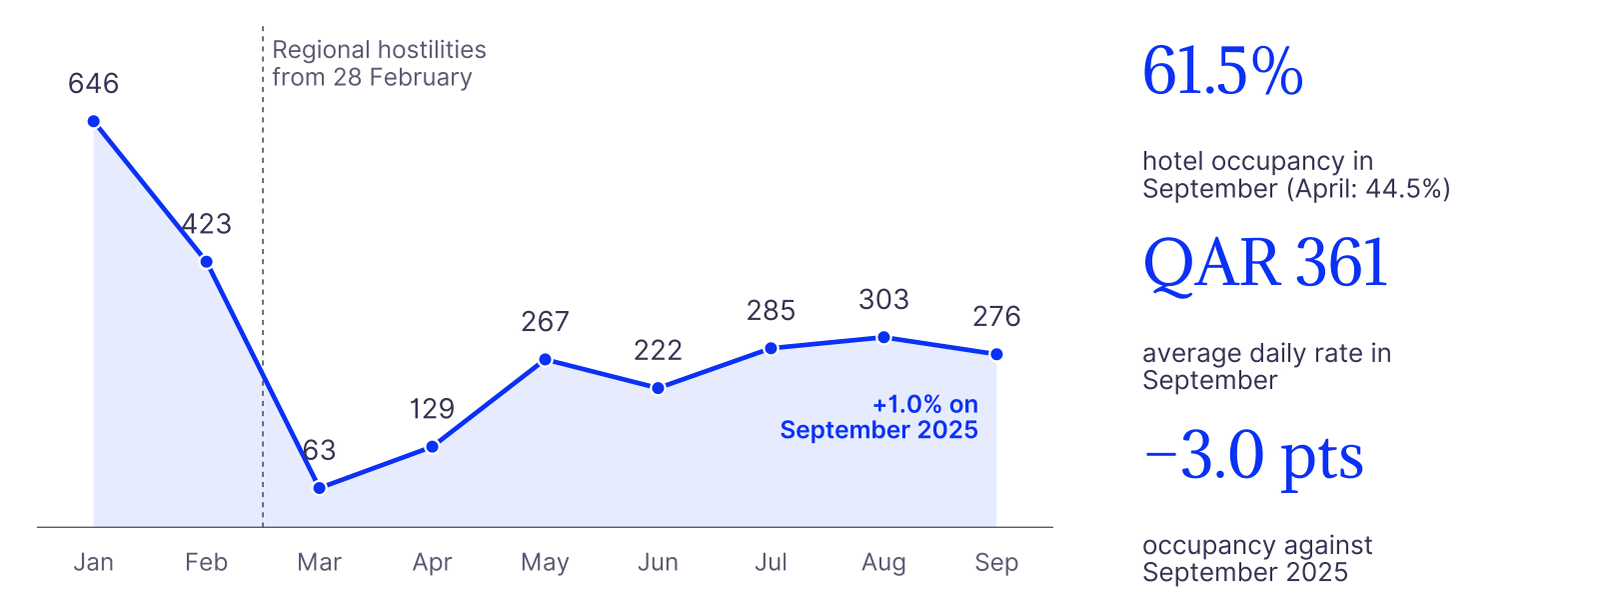
Visitor numbers steadied over the summer (Exhibit 14), at 285,000 in July, 303,000 in August and 276,000 in September, after arrivals fell to 63,000 in March.13 September arrivals were 1.0% above September 2025, though the third quarter as a whole was 5.5% below last year and the first nine months about a quarter lower.
Exhibit 14
Visitor arrivals have steadied since the spring, and September edged above last year.
Monthly visitor arrivals, Qatar, January to September 2026, thousands; hotel indicators, September 2026, as published
Note: Hotel indicators cover the full market of hotels and hotel apartments, about 42,500 rooms.
Source: Qatar Tourism, Visitor Arrivals and Accommodation dashboards, data to September 2026; Reeve Hayward analysis
Occupancy across hotels and hotel apartments rose to 61.5% in September, from 44.5% in April, at an average daily rate of QAR 361. It was 3 percentage points below September 2025, a narrower gap than the 5 points of August.14 The winter calendar should help. Formula 1 confirmed on 3 October that the Qatar Grand Prix will go ahead at Lusail from 27 to 29 November, and Qatar Tourism’s 2026–27 calendar lists more than 560 events.15
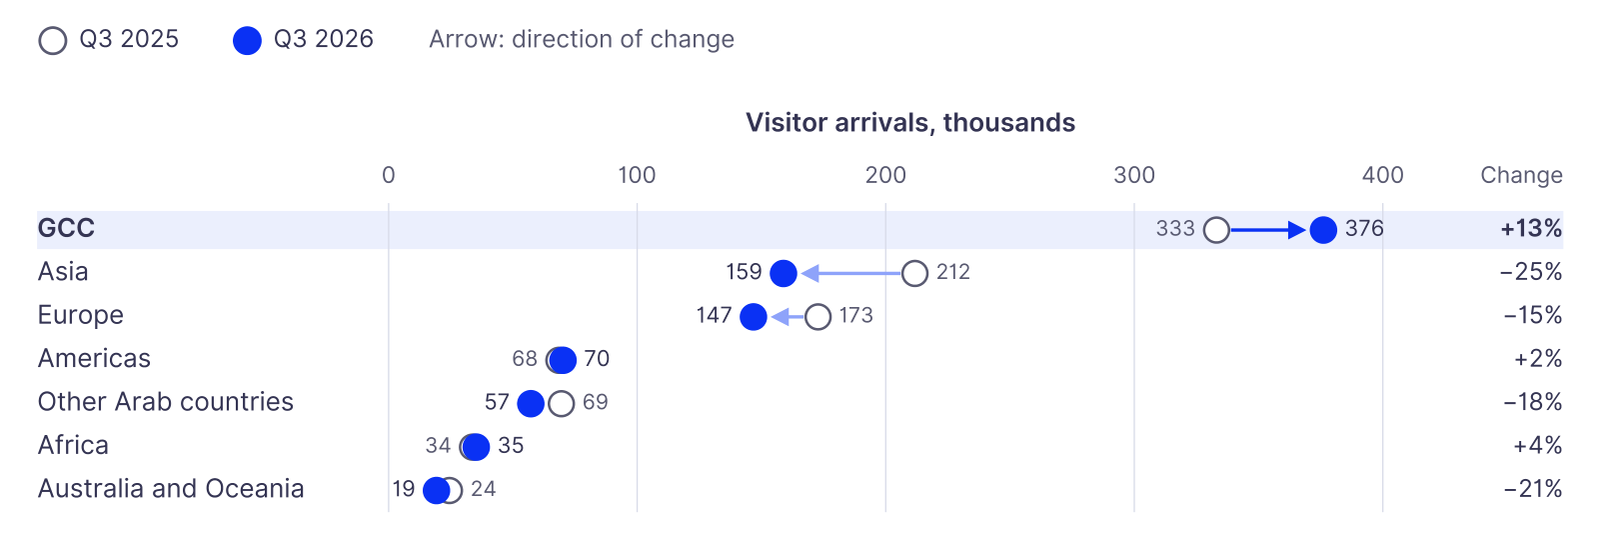
Visitors came increasingly from the region (Exhibit 15). GCC arrivals rose 13% on the year, led by Saudi Arabia, and made up 44% of the quarter’s arrivals against 36% a year earlier. Arrivals by land, across the Saudi border, rose 15% and arrivals by air fell 15%.16
Exhibit 15
GCC arrivals rose 13% while Asia and Europe fell.
Visitor arrivals by source region, Qatar, third quarter 2025 and 2026, thousands
Note: Qatar Tourism regions; Americas combines North and South America. All arrivals: 864,000 (914,000 a year earlier).
Source: Qatar Tourism, Visitor Arrivals dashboard, data to September 2026; Reeve Hayward analysis
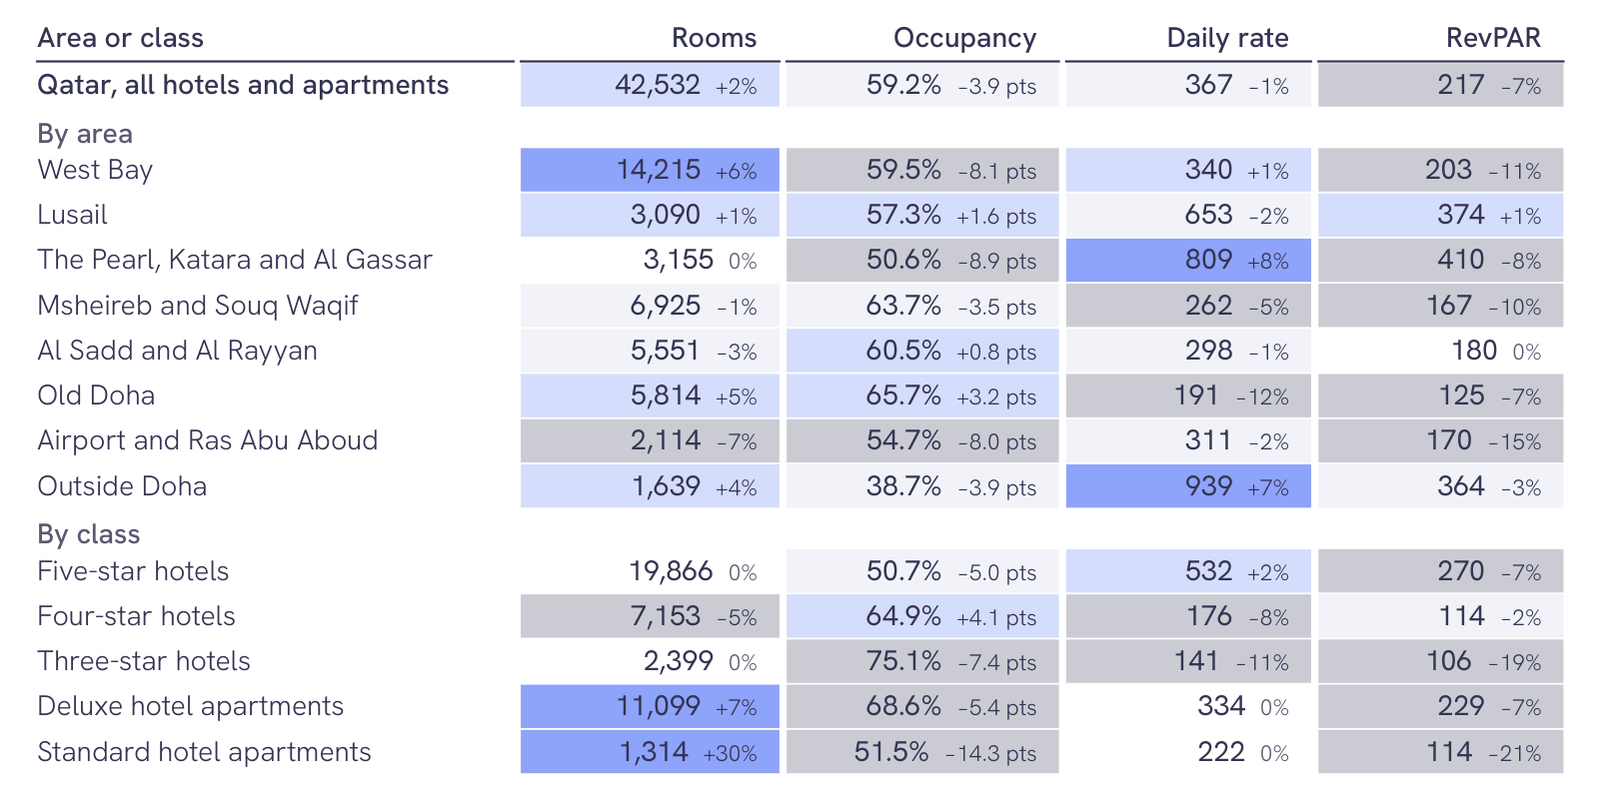
Hotel results split by area (Exhibit 16). Revenue per available room in the third quarter was 7% below a year earlier across the market, but held level in Lusail and in Al Sadd and Al Rayyan. West Bay and hotel apartments added rooms faster than the market, so part of their fall in occupancy reflects new supply as well as fewer guests.
Exhibit 16
Revenue per room held up only in Lusail and Al Sadd.
Hotels and hotel apartments, third quarter 2026; change on a year earlier, %
Note: Shading shows the change on a year earlier: darker blue, up 5% or more; light blue, up 0.5–5%; white, little changed; light grey, down 0.5–5%; darker grey, down 5% or more. Rooms available per night; rates in QAR; RevPAR: revenue per available room.
Source: Qatar Tourism, Accommodation dashboard, data to September 2026; Reeve Hayward analysis
What could shape 2027
We expect the market to remain broadly steady into 2027 and to strengthen as gas exports resume. Our view rests on how three sets of forces, geopolitical, international and domestic, are likely to evolve, and on how each reaches the property market (Exhibit 17).
Exhibit 17
Shipping sets the pace of the recovery, interest rates temper it, and household demand cushions it.
How geopolitical, international and domestic forces reach Qatar’s property market, and what we assume for 2027
| Force | How it reaches property | What we assume for 2027 | Likely effect |
|---|---|---|---|
| Geopolitical Shipping through Hormuz and LNG exports | Hydrocarbons provide about 80% of government revenue. Exports fund spending, project awards and hiring, and through them housing demand. | Export routes reopen gradually from early 2027 and force majeure is lifted in stages; the first North Field East train starts in the first half. | Headwind into early 2027, then the main source of recovery |
| International US rates, energy prices and visitors | The riyal’s peg passes US rates through to mortgages and development finance; energy prices set export revenue; visitors fill hotels. | Federal funds near 4.1% through 2027 after one more rise; Brent about $84 a barrel; visitors recover with flights and events. | Mixed: dearer money, firmer revenue once exports resume |
| Domestic Households, the budget and new supply | Owner-occupiers drive villa and land demand; public spending drives hiring; permits and completions set future supply. | Budget back in surplus in 2027; permits up 26% in the second quarter point to steady supply; freehold areas keep widening. | Supportive: broad demand led by households |
Note: Assumptions are Reeve Hayward judgments informed by the sources below. The World Bank assumes the Strait of Hormuz reopens gradually from 31 December 2026, LNG production resumes from early 2027, and about a third of North Field East operates in 2027.
Source: World Bank, Macro Poverty Outlook for Qatar, October 2026; US Federal Reserve, Summary of Economic Projections, September 2026; US Energy Information Administration, Short-Term Energy Outlook, 6 October 2026; Reeve Hayward analysis
Geopolitical: Shipping sets the pace
Shipping through the Strait of Hormuz is the decisive variable. Hydrocarbons provide about 80% of government revenue, so the restart of LNG exports sets the pace for public spending, project awards and hiring, and through them for housing demand.17 LNG flows through the strait were still more than three-quarters below normal in September, at 21 cargoes against about 90 a month before the hostilities.18 QatarEnergy has extended force majeure on some deliveries to the end of November, and renewed attacks on tankers since late September make a quick return to normal unlikely.19 We assume, as the World Bank does, that export routes reopen gradually from the turn of the year and that the first North Field East train starts in the first half of 2027.
International: Money stays dearer for longer
The Federal Reserve’s median projection implies one more increase this year and no reduction in 2027.20 With the riyal pegged to the dollar, the QCB is likely to follow, keeping financing costs above their 2025 levels. Energy prices pull the other way. Brent averaged about $114 a barrel in September, and the US Energy Information Administration expects about $84 in 2027, still enough to lift export revenue sharply once Qatari cargoes move.21 Visitor numbers, about a quarter below last year in the first nine months, should recover with flights and events.22
Domestic: Household demand cushions the market
Domestic conditions are firmer. Real estate was the fastest-growing non-hydrocarbon activity in the second quarter, building permits rose 26% on the first quarter, and the World Bank expects inflation of 2.7% this year and the budget to move from a deficit of 7.1% of GDP in 2026 to a surplus of 3.2% in 2027.23 Policy continues to widen the market. Law No. 13 of 2026 moves the regulation and licensing of real estate brokerage to Aqarat, and Cabinet Decision No. 21 of 2026 added the Simaisma project to the areas where non-Qataris may own property.24
A recovery in two steps
Putting these forces together, we expect the recovery to come in two steps. Until export routes reopen, activity is likely to hold close to the pace of 2026: about QAR 5.0 billion to 6.0 billion of registered sales in the fourth quarter and QAR 5.0 billion to 6.5 billion a quarter in the first half of 2027, with prices broadly flat. As LNG exports resume and the first North Field East train comes on stream, public spending, hiring and visitor demand could lift sales toward QAR 5.5 billion to 7.0 billion a quarter in the second half, with villa and prime freehold prices perhaps 2 to 5% higher than today.
The recovery is unlikely to be even (Exhibit 18). Villas and residential land combine steady household demand with measured supply and look the most resilient. Apartments in newer districts, where supply is still being absorbed, and offices, which depend on project awards, are likely to lag. Hotels could recover first, helped by the winter season and the FIBA Basketball World Cup in Doha from 27 August 2027.
Exhibit 18
Villas, land and hotels look most resilient; Lusail apartments and offices look most exposed.
Reeve Hayward view of the likely direction in 2027 against third-quarter 2026 levels
| Segment | Activity, prices, rents | Why |
|---|---|---|
| Villas and houses | ↗ ↗ → | Household-led demand and measured supply; prices up in five of the six main municipalities on the year |
| Residential land | ↗ ↗ – | Prices up 18% on the year; steady plot demand and rising permits |
| Apartments, The Pearl | → → → | Mature district; prices up 5% on the year, rents level at QAR 10,000 |
| Apartments, Lusail | → ↘ ↘ | Prices 18% below a year ago and rents softer while supply is absorbed |
| Mass-market apartments | → → ↘ | Plentiful affordable stock; Al Wakra rents down 4% on the quarter |
| Offices | ↘ ↘ ↘ | Leasing down 9% and rents down 6% on the quarter; tied to project awards |
| Shops | → → ↘ | Leasing up 8% on the year, but rents down 5% on the quarter |
| Hotels (room rates) | ↗ – ↗ | Occupancy up from 45% in April to 61.5% in September; Formula 1 and the FIBA World Cup ahead |
Note: Arrows show activity, prices and rents, in that order: ↗ rising; → broadly stable, within about 3% either way; ↘ falling; – not assessed. Judgments, not forecasts.
Source: Reeve Hayward analysis of Ministry of Justice (sales and prices), Aqarat (rents) and Qatar Tourism data
Six signposts we will watch
Each part of our view leaves a trail in data published weekly or monthly. We list six readings in the order in which they are likely to move:
- Shipping and LNG exports. Twenty-one LNG cargoes passed through the strait in September. Force majeure lifted and transits returning toward normal would make us more positive; disruption well into 2027, more cautious.
- Interest rates. The federal funds target range is 3.75 to 4.00% and the QCB’s repo rate 4.35%. Rates held after one more rise would fit our view; two or more further rises would not.
- Weekly sales registrations. Registrations averaged about QAR 425 million a week in the third quarter. Several weeks above QAR 500 million would point to an earlier recovery, several below QAR 250 million to a weaker one.
- Lease registrations. Aqarat registered about 10,700 contracts a month. More than 11,000 a month would signal firmer demand; fewer than 9,500, weaker.
- Visitors and hotels. Occupancy above 70% through the winter would support our view of hotels; event postponements or occupancy below 55% would not.
- Public spending and policy. New project awards, wider freehold areas or buyer incentives would make us more positive; further spending cuts or delayed reforms, more cautious.
The dates to watch are the Federal Reserve decisions of 28 October and 9 December, which the QCB usually follows within days; the Qatar Grand Prix from 27 to 29 November, when the current LNG force majeure also runs out; the first North Field East train in the first half of 2027; and the FIBA Basketball World Cup in Doha from 27 August to 12 September 2027.
Qatar’s property market has absorbed higher interest rates, a collapse in gas exports and a sharp fall in visitors without a broad fall in prices or registered activity. That resilience reflects a market led by households and owner-occupiers more than by leveraged investors, and a run of policy reforms that continues to widen it.
Because the pace of recovery in 2027 depends mostly on forces outside the property market, we would watch the signposts above more closely than any single month of sales. The quarter’s evidence suggests that villas, land and established freehold districts have held their value best, while newer apartment districts and offices are still absorbing supply. Leaders planning for 2027 may find it useful to test their plans against the timing of export routes reopening rather than against a single quarter’s results.
About this report
The Research team at Reeve Hayward prepared this report in Doha. To discuss the findings, contact the team at info@reevehayward.com or +974 5577 4811.
This publication is provided for general information only and does not constitute investment, legal, tax, or regulatory advice, or an offer or recommendation to buy, sell, or hold any property. Gross yields are indicative ratios of median rents to median prices and must not be relied upon to value or price any asset. Statements about the outlook are analytical judgments, not forecasts. It is for information only and is not investment advice.
Sources
- Reeve Hayward analysis of Ministry of Justice open-data registration files, at share value; registrations on October 1 are excluded.
- Ministry of Justice open-data files, July to September 2025 and 2026; July 1 to 3, 2025 from the weekly bulletin, as that week is not in the open data.
- US Federal Reserve, “Federal Open Market Committee statement,” September 16, 2026; Qatar Central Bank decision as reported in “QCB increases interest rates,” The Peninsula, September 16, 2026.
- National Planning Council, “Quarterly gross domestic product, second quarter 2026,” September 30, 2026.
- World Bank, “Macro Poverty Outlook for Qatar,” October 2026.
- Amiri Diwan announcement of July 12, 2026, as reported in “Qatar announces public mourning period,” Kuwait Times, July 2026. The ministry’s bulletins record no registrations from July 13 to 16.
- Reeve Hayward analysis of Ministry of Justice open-data registration files, July 1 to September 30, 2026.
- Reeve Hayward analysis of Ministry of Justice open-data weekly registration files, April to June and July to September 2026 and July to September 2025 (July 1 to 3, 2025 from the weekly bulletin). Price per square meter is share value divided by share area.
- Qatar Central Bank real estate price index, August 2026, as republished by Trading Economics, September 2026.
- Ministry of Justice open-data weekly registration files, residential units (The Pearl: 111 sales in 2026, 197 in 2025); Aqarat lease contracts.
- Reeve Hayward analysis of Aqarat rental indicators, Qatar Real Estate Platform, accessed October 7, 2026.
- Reeve Hayward analysis of 21,130 listings on various online portals captured October 6–7, 2026, against Ministry of Justice registered prices and Aqarat registered rents.
- Qatar Tourism, Visitor Arrivals dashboard, monthly data to September 2026, accessed October 14, 2026.
- Qatar Tourism, Accommodation dashboard, Qatar full market (hotels and hotel apartments), monthly data to September 2026, accessed October 14, 2026.
- Formula 1 announcement, October 3, 2026; Qatar News Agency, “Qatar Tourism unveils 2026–2027 calendar featuring over 560 events,” September 16, 2026.
- Qatar Tourism, Visitor Arrivals and Accommodation dashboards, July to September 2025 and 2026, accessed October 14, 2026.
- World Bank, “Macro Poverty Outlook for Qatar,” October 2026.
- “Hormuz LNG flows still down more than 75% despite rebound,” OilPrice.com, October 5, 2026.
- “Qatar extends LNG force majeure as Hormuz disruption threatens winter supply,” Bloomberg, via The National, September 28, 2026; “Gulf oil exports rebound, but rising tanker attacks threaten global supply,” Reuters, via NBC News, October 5, 2026.
- US Federal Reserve, “Summary of Economic Projections,” September 16, 2026.
- US Energy Information Administration, “Short-Term Energy Outlook,” October 6, 2026.
- Qatar Tourism, Visitor Arrivals dashboard: 2.61 million arrivals in January to September 2026, against 3.55 million a year earlier.
- Ministry of Municipality figures as reported in “Qatar construction activity accelerates in Q2 2026,” The Peninsula, August 13, 2026; World Bank, October 2026.
- “Qatar: Real Estate Regulatory Authority gains powers over brokerage sector,” LexisNexis Middle East, September 26, 2026; “Qatar allows foreign property ownership in Simaisma Resort and Beach Project,” The Peninsula, June 9, 2026.
To discuss what this means for your business, speak with our team. Initial conversations are confidential and without obligation.
Speak with our team


