

Ships still cross the Strait of Hormuz, but on other routes, at other prices and through other ports. This report traces how eight months of disruption rewired tanker, gas and container trade worldwide.
Eight months after shipping through the Strait of Hormuz was disrupted, the Gulf’s trade is moving again, but by other means, at other prices and through other ports. The US Energy Information Administration (EIA) estimates that 4.9 million barrels a day of oil crossed the strait in the second quarter of 2026, under a quarter of the 2025 average of 21.2 million (Exhibit 1), while oil through Bab el-Mandeb, at the southern end of the Red Sea, rose from 5.4 million barrels a day in the last quarter of 2025 to 8.1 million.1
Exhibit 1
Oil and LNG flows through the strait fell sharply in the first half of 2026.
Oil and liquefied natural gas (LNG) carried through the Strait of Hormuz, by quarter, 2025 and 2026, million barrels a day and billion cubic feet a day
| Quarter | Total oil | Crude oil and condensate | Petroleum products | LNG (billion cubic feet a day) |
|---|---|---|---|---|
| Q1 2025 | 20.9 | 14.8 | 6.2 | 11.7 |
| Q2 2025 | 21.0 | 14.9 | 6.2 | 11.0 |
| Q3 2025 | 21.3 | 15.0 | 6.3 | 10.9 |
| Q4 2025 | 21.6 | 15.9 | 5.7 | 10.5 |
| Q1 2026 | 14.9 | 10.9 | 4.0 | 7.4 |
| Q2 2026 | 4.9 | 3.7 | 1.1 | 0.8 |
Note: EIA estimates from tanker-tracking data, supplemented by analysis of the ports where cargoes load and discharge. Oil is crude oil, condensate and petroleum products; in the second quarter of 2026, crude oil and condensate were 3.7 million barrels a day and products 1.1 million. The EIA notes that its 2026 tracking data for the strait are being revised frequently.
Source: US EIA, Short-Term Energy Outlook, Global Energy Security Data, Table 4, August 12, 2026; Reeve Hayward analysis
How that trade still moves, and what it now costs, is the subject of this report. Trade has found a way through, but each way costs more. International Seaways, a listed tanker owner, earned $154,597 a day on its supertankers in the third quarter, 4.4 times the $34,809 of a year earlier, and DHT put its supertankers’ spot earnings for the quarter at $167,100 a day.2 Tanker operators reported that war-risk premiums escalated as the disruption went on.3 Brent crude averaged $125 a barrel in October, 93% more than a year earlier, and European gas $28.50 per million British thermal units, 162% more.4
The map of Gulf shipping has been redrawn with them. The OECD reports a major increase in traffic at ports outside the strait, at Salalah, Duqm and Sohar in Oman and at Fujairah and Khor Fakkan in the UAE, while thousands of trucks have been crossing the Arabian Peninsula, north towards Türkiye and Europe and west to the Red Sea.5 World trade has absorbed the shock better than its scale suggested: the OECD found in September that global merchandise trade had recovered gradually after the initial impact of the conflict.6
This report sets out what passes through the strait and who depends on it; what the traffic data show; how the tanker, gas and bulk markets have repriced; how ports and shipping lines have redrawn the Gulf’s network; security and insurance; the bypass routes; what it all means for world trade; and the risks and signposts to watch. Our report of 3 November covered food and fertilizer; this one covers the ships and the trade they carry. It does not forecast the conflict, value any company or recommend any security (see sidebar, “About the research”).
What passes through Hormuz, and who depends on it
The strait is narrow in what it carries as well as in width. In the first half of 2025, about 20.9 million barrels a day of oil passed through it, about a quarter of all oil traded by sea and about 20% of world oil consumption, along with more than 20% of world trade in liquefied natural gas (LNG).7
By value, the Gulf’s exports are concentrated in a handful of products that other economies cannot easily replace (Exhibit 2). In 2024, the seven economies whose ports lie inside the strait (Bahrain, Iran, Iraq, Kuwait, Qatar, Saudi Arabia and the United Arab Emirates, UAE) supplied 49% of world imports of sulfur, 34% of crude oil, 33% of helium and rare gases, 30% of methanol, 25% of propane, 23% of polyethylene, 22% of urea and 19% each of LNG and unwrought aluminum, against 4.1% of all goods.8 Qatar alone produced 33% of the world’s helium in 2025.9
Exhibit 2
The Gulf supplies a third or more of world trade in sulfur, crude oil and helium, but 4% of all goods.
Imports from the seven economies inside the Strait of Hormuz as a share of world imports, by product, 2024, % of import value
| Product | 2024 |
|---|---|
| Sulfur | 49.4 |
| Crude oil | 34.1 |
| Helium and rare gases | 33.1 |
| Methanol | 29.7 |
| Propane | 25.1 |
| Polyethylene | 23.0 |
| Urea | 21.7 |
| LNG | 19.1 |
| Unwrought aluminum | 18.6 |
| All goods | 4.1 |
Note: Bahrain, Iran, Iraq, Kuwait, Qatar, Saudi Arabia and the UAE, by country of origin as recorded by importers. Includes Saudi and UAE exports loaded outside the strait; Iranian-origin trade is largely missing from partner data.
Source: UN Comtrade, accessed November 5, 2026; Reeve Hayward analysis
The buyers are mostly in Asia. Of the crude oil that passed through the strait in the first half of 2025, 89% went to Asian markets: China took 36.6%, India 13.9%, South Korea 11.8% and Japan 11.6%.10 Customs data show how deep that dependence runs (Exhibit 3). In 2024, the Gulf economies supplied 99.6% of Pakistan’s crude oil imports by value, 94.6% of Japan’s, 70.7% of South Korea’s, 61.1% of Taiwan’s and 46.1% of India’s, against 12.8% for the European Union and 9.2% for the United States; for LNG, the shares were 88.2% for Pakistan and 54.2% for India.11 The International Energy Agency (IEA) adds that Bangladesh, India and Pakistan imported almost two-thirds of their LNG through the strait in 2025.12
Exhibit 3
Japan, South Korea and South Asia buy most of their crude oil from the Gulf; Europe and the United States buy little.
Imports from the seven economies inside the Strait of Hormuz as a share of each importer’s imports, crude oil and LNG, 2024, % of import value
| Importer | Crude oil | LNG |
|---|---|---|
| Pakistan | 99.6 | 88.2 |
| Japan | 94.6 | 6.1 |
| South Korea | 70.7 | 23.4 |
| Malaysia | 68.2 | 0.0 |
| Taiwan | 61.1 | 24.0 |
| Thailand | 59.8 | 22.9 |
| Singapore | 52.3 | 24.8 |
| India | 46.1 | 54.2 |
| China | 37.8 | 25.1 |
| European Union | 12.8 | 8.7 |
| United States | 9.2 | 0.0 |
Note: Importers’ customs declarations by country of origin; an upper bound for dependence on the strait, because Saudi and UAE exports loaded outside it are included. Taiwan is reported as “Other Asia, not elsewhere specified.” The European Union is the sum of member states, including trade between them.
Source: UN Comtrade, accessed November 5, 2026; Reeve Hayward analysis
The Gulf’s own economies depend on the strait in different degrees, and the difference shaped how each one adapted. Qatar, Kuwait, Bahrain and Iraq have no seaport outside the strait, so their seaborne trade normally passes through it; the UAE also has Fujairah and Khor Fakkan on the Gulf of Oman; Saudi Arabia has its Red Sea ports as well as its Gulf coast; and Oman’s ports all lie outside. That is why land routes, pipelines and the ports of Oman and the UAE’s east coast mattered so much in 2026, and why Qatar’s long-standing investment in multiple supply routes, including the land crossing with Saudi Arabia and direct services to Omani ports, has been tested and has held.
Counting the ships: Why the traffic numbers differ
Every count of ships through the strait shows a fall, but ship-tracking counts now understate what moves. Since the end of February, the automatic identification system (AIS) signals that ships broadcast in the strait have become, in the EIA’s words, “especially unreliable,” because many ships cross with their transponders off. The EIA’s estimates of cargo volumes therefore supplement tanker tracking with analysis of the ports where cargoes load and discharge, and the agency notes that its 2026 figures for the strait are being revised frequently.13
What still crosses: Crude oil, products and gas
The fall has not been the same for every cargo (Exhibit 1). The EIA estimates that crude oil and condensate through the strait fell from 15.9 million barrels a day in the last quarter of 2025 to 3.7 million in the second quarter of 2026, and petroleum products from 5.7 million to 1.1 million; Gulf LNG shipments through the strait remain well below pre-conflict levels.14 Container ships are the clearest case of avoidance, as the large lines routed Gulf cargo through ports outside the strait.
The strait is one link in a chain of chokepoints, and the others have moved with it (Exhibit 4). Oil through Bab el-Mandeb rose from 5.4 million barrels a day in the last quarter of 2025 to 8.1 million in the second quarter of 2026, while flows around the Cape of Good Hope held at 8 to 10 million and those through the Suez Canal and the SUMED pipeline at close to 6 million.15 The Suez Canal itself is recovering: it handled 1,490 transits and $724 million of revenue in October, 94% more revenue than a year earlier and the highest monthly figures since the Red Sea crisis began.16
Exhibit 4
Oil through Hormuz fell to 4.9 million barrels a day in the second quarter of 2026, while flows through Bab el-Mandeb rose by half.
Crude oil and petroleum liquids carried through selected chokepoints and around the Cape of Good Hope, by quarter, 2025 and 2026, million barrels a day
| Quarter | Strait of Hormuz | Cape of Good Hope | Bab el-Mandeb | Suez Canal and SUMED |
|---|---|---|---|---|
| Q1 2025 | 20.9 | 9.0 | 3.9 | 4.6 |
| Q2 2025 | 21.0 | 9.3 | 4.5 | 5.1 |
| Q3 2025 | 21.3 | 9.0 | 4.6 | 5.6 |
| Q4 2025 | 21.6 | 9.9 | 5.4 | 5.9 |
| Q1 2026 | 14.9 | 8.2 | 5.6 | 5.7 |
| Q2 2026 | 4.9 | 9.4 | 8.1 | 5.8 |
Note: EIA estimates from tanker-tracking data. The Suez Canal series includes the SUMED pipeline. Other chokepoints, such as the Strait of Malacca, are not shown. The EIA notes that its 2026 tracking data for Hormuz are being revised frequently.
Source: US EIA, Short-Term Energy Outlook, Global Energy Security Data, Table 2, August 12, 2026; Reeve Hayward analysis
Energy shipping: Record tanker earnings, cheaper LNG carriers
Tanker owners have reported record profits, because the same oil now takes more ships to move. Frontline told investors in August that waiting times and ship-to-ship transfers had absorbed more tankers than cargo volumes alone would require, and described a “relocation of loadings toward the Atlantic Basin” as Asian refiners replaced part of their Gulf supply with cargoes that travel further.17
Reported earnings show how far the gains spread (Exhibit 5). International Seaways earned 4.4 times as much per day on its supertankers in the third quarter as a year earlier, 3.1 times as much on Suezmaxes and twice as much on Aframaxes; Scorpio’s large product tankers earned 75% more, Dorian’s liquefied petroleum gas (LPG) carriers 81% more, and Genco’s dry bulk fleet, which barely trades with the Gulf, 73% more.18 International Seaways reported record net income of $344 million for the quarter, and Frontline a record $659 million for the second.19 Ship values followed: Frontline sold two 2017-built supertankers for $135 million each, the price Scorpio agreed for each of two new ones for delivery in 2028.20 Bunker fuel added to costs: very low sulfur fuel oil averaged $826 a tonne in Singapore and Fujairah in the third quarter, 64% more than a year earlier.21
Exhibit 5
Tanker owners earned up to four times as much per day as a year earlier, led by supertankers.
Time-charter-equivalent earnings reported by listed shipowners, by segment, third quarter of 2025 and 2026, $ thousand a day
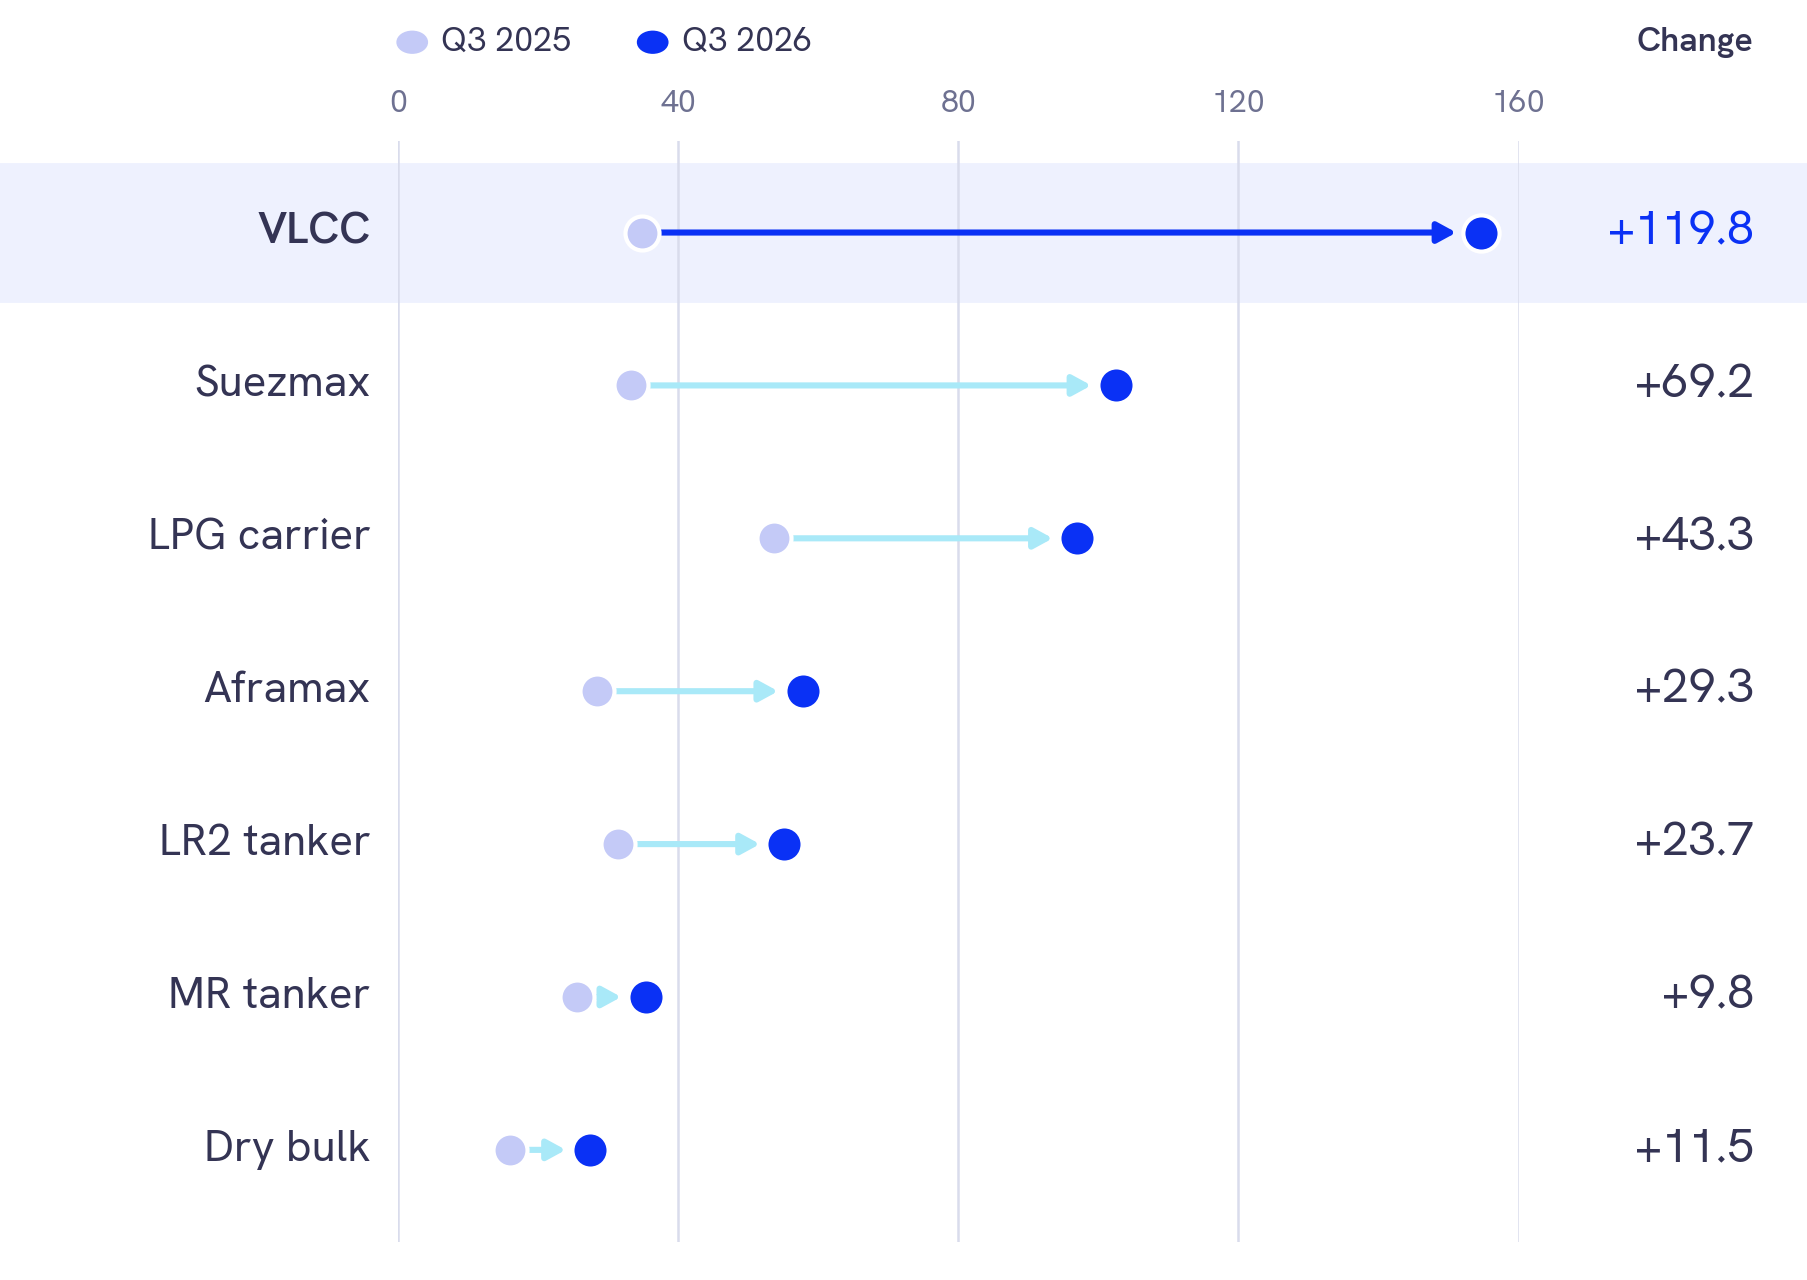
Note: Spot or pool earnings for VLCC, Suezmax, Aframax and MR tankers (International Seaways), all employment for LR2 product tankers (Scorpio Tankers), fleet averages for very large gas carriers (Dorian LPG) and dry bulk (Genco). Change in $ thousand a day. Company earnings lag market assessments.
Source: International Seaways; Scorpio Tankers; Dorian LPG; Genco Shipping & Trading, third-quarter 2026 results; Reeve Hayward analysis
Oil has kept moving, at a price. The Brent price rose from $71 a barrel in February to $120 in April, eased to $83 in July and reached $125 in October; the Dubai benchmark averaged $102.70 in October, $22 below Brent, against a gap of 40 cents a year earlier.22 The EIA expects Brent to average $105 in the fourth quarter.23
LNG shipping has moved the other way. With Gulf cargoes reduced and a large new fleet arriving, spot rates for LNG carriers have fallen and swung widely: Capital Clean Energy Carriers reported that Atlantic spot rates for modern carriers averaged $51,039 a day in the third quarter, after trading above $90,000 at its start and dropping to about $10,000 in August.24 About 55 carriers were delivered in the first seven months of the year and some 285 remain on order, about 37% of the fleet.25 Gas itself has risen in price: the European benchmark averaged $28.50 per million British thermal units in October, against $11.24 in February.26 LNG that would have crossed the strait was replaced in part by longer voyages: the EIA estimates that LNG shipped around the Cape rose to 9.7 billion cubic feet a day in the second quarter, from 7.0 a year earlier.27 On 29 October QatarEnergy signed a 20-year agreement to buy up to 3 million tonnes a year of LNG from Woodside’s Louisiana LNG project in the United States, broadening its supply portfolio.28
Petrochemical exporters found other routes as well: Borouge, the UAE’s polyolefins producer, shipped all its available output without depending on the strait.29
Containers and ports: A new map of the Gulf
Container lines have kept serving the Gulf, but through different ports and at higher cost. The ports outside the strait carried the load: the OECD reports a major increase in traffic at Salalah, Duqm and Sohar in Oman and at Fujairah and Khor Fakkan in the UAE. Overland links have grown alongside them. Thousands of trucks have been crossing the Arabian Peninsula, north towards Türkiye and Europe and west to the Red Sea, and the OECD notes the congestion this has caused at border crossings.30 The land leg adds cost: Emirates Shipping Line charges $1,250 a box to truck upper Gulf cargo from Khor Fakkan to Jebel Ali and $2,350 from Sohar.31
Qatar’s ports have kept the country supplied through these routes. Mwani Qatar handled 59,022 containers in October, 9% more than in September, and 249 vessel calls, the most of any month this year and slightly more than in October 2025; bulk cargo, at 53,586 tonnes, was more than four times its level of a year earlier.32 Qatar’s own shipping group has added services through the bypass ports: Milaha runs a direct service from China to Fujairah and Sohar, with onward connections.33
The disruption has also tightened ship capacity worldwide. Sea-Intelligence found that vessel delays absorbed 1.7 million twenty-foot equivalent units (TEU) of capacity in August, 5.0% of the deep-sea fleet against a norm of 2.2%.34
Security and insurance
The security situation remains the binding constraint on traffic. US Central Command said on 25 October that more than 3,000 commercial vessels had transited with its support over six months.35 Use of a northern route is controlled by an Iranian authority, and the US Treasury warned in August against dealing with it.36
Insurance has followed the risk. Heidmar, a tanker operator, said that escalating war-risk premiums had constrained the supply of ships available to trade.37 The US Development Finance Corporation set up a $40 billion reinsurance facility for Gulf shipping in March, though the Congressional Research Service noted in May that it was unclear whether any cover had been written.38
Bypass routes: Pipelines and railways
The Gulf’s bypass pipelines have carried more of the load. Before the disruption, the EIA estimated that Saudi Aramco’s East–West crude oil pipeline and the UAE’s Abu Dhabi pipeline could together provide about 4.7 million barrels a day of capacity to bypass the strait, and that the UAE planned to build another pipeline of 1.5 million barrels a day around it by 2027.39 The rise in oil through Bab el-Mandeb (Exhibit 4) is consistent with more Gulf oil leaving from Saudi Arabia’s Red Sea coast.
For goods, the bypass is a road and, in time, a railway. Oman ratified an agreement in September for Hafeet Rail, a line linking Sohar with Abu Dhabi.40 The railway of the Gulf Cooperation Council (GCC), more than 1,700 kilometers linking all six member states, was more than half complete in May and is due to be fully operational by the end of 2030; on 8 November, Qatar and the other member states signed a general agreement in Manama that sets out each country’s responsibilities and a timeline for execution and operation.41
What it means for world trade
World trade has proved more resilient than the scale of the shock suggested. The OECD found in September that global merchandise trade had recovered gradually after the initial impact of the conflict, despite rising transport costs, with shipments of goods linked to artificial intelligence a major support, and that the recovery continued into the third quarter.42 It projects world GDP growth of 2.9% in 2026 and 3.0% in 2027, with energy prices assumed to ease through 2027 in line with futures markets.43
The cost is concentrated. The OECD names persisting constraints on exports through the strait, further disruption to alternative routes such as Bab el-Mandeb and damage to energy facilities in the region as risks that could prompt a further sustained rise in energy prices, particularly for countries that import energy.44 The importers most exposed are in Asia, as the customs data show (Exhibit 3).
Risks and signposts
Eight risks follow from the evidence above. We place them on a map of likelihood over the next twelve months and impact on shipping and trade (Exhibit 6). One sits in the very high band: transit through the strait that stays restricted well into 2027. Four sit in the high band: attacks on bypass pipelines, terminals and anchorages; a renewed closure of the Red Sea route; freight and insurance that stay well above their 2025 levels; and bypass ports and border crossings that run out of capacity. The other three, including a fast reopening that releases ships into a large orderbook, sit in the medium band. The placements are our judgment, based on the data cited in this report, and the map is meant to be redrawn as the signposts below move.
Exhibit 6
The largest risk is a restriction on transit that lasts well into 2027; attacks on the bypass routes come next.
Risks to shipping and trade from the Hormuz disruption, by likelihood over the next twelve months and impact, Reeve Hayward assessment
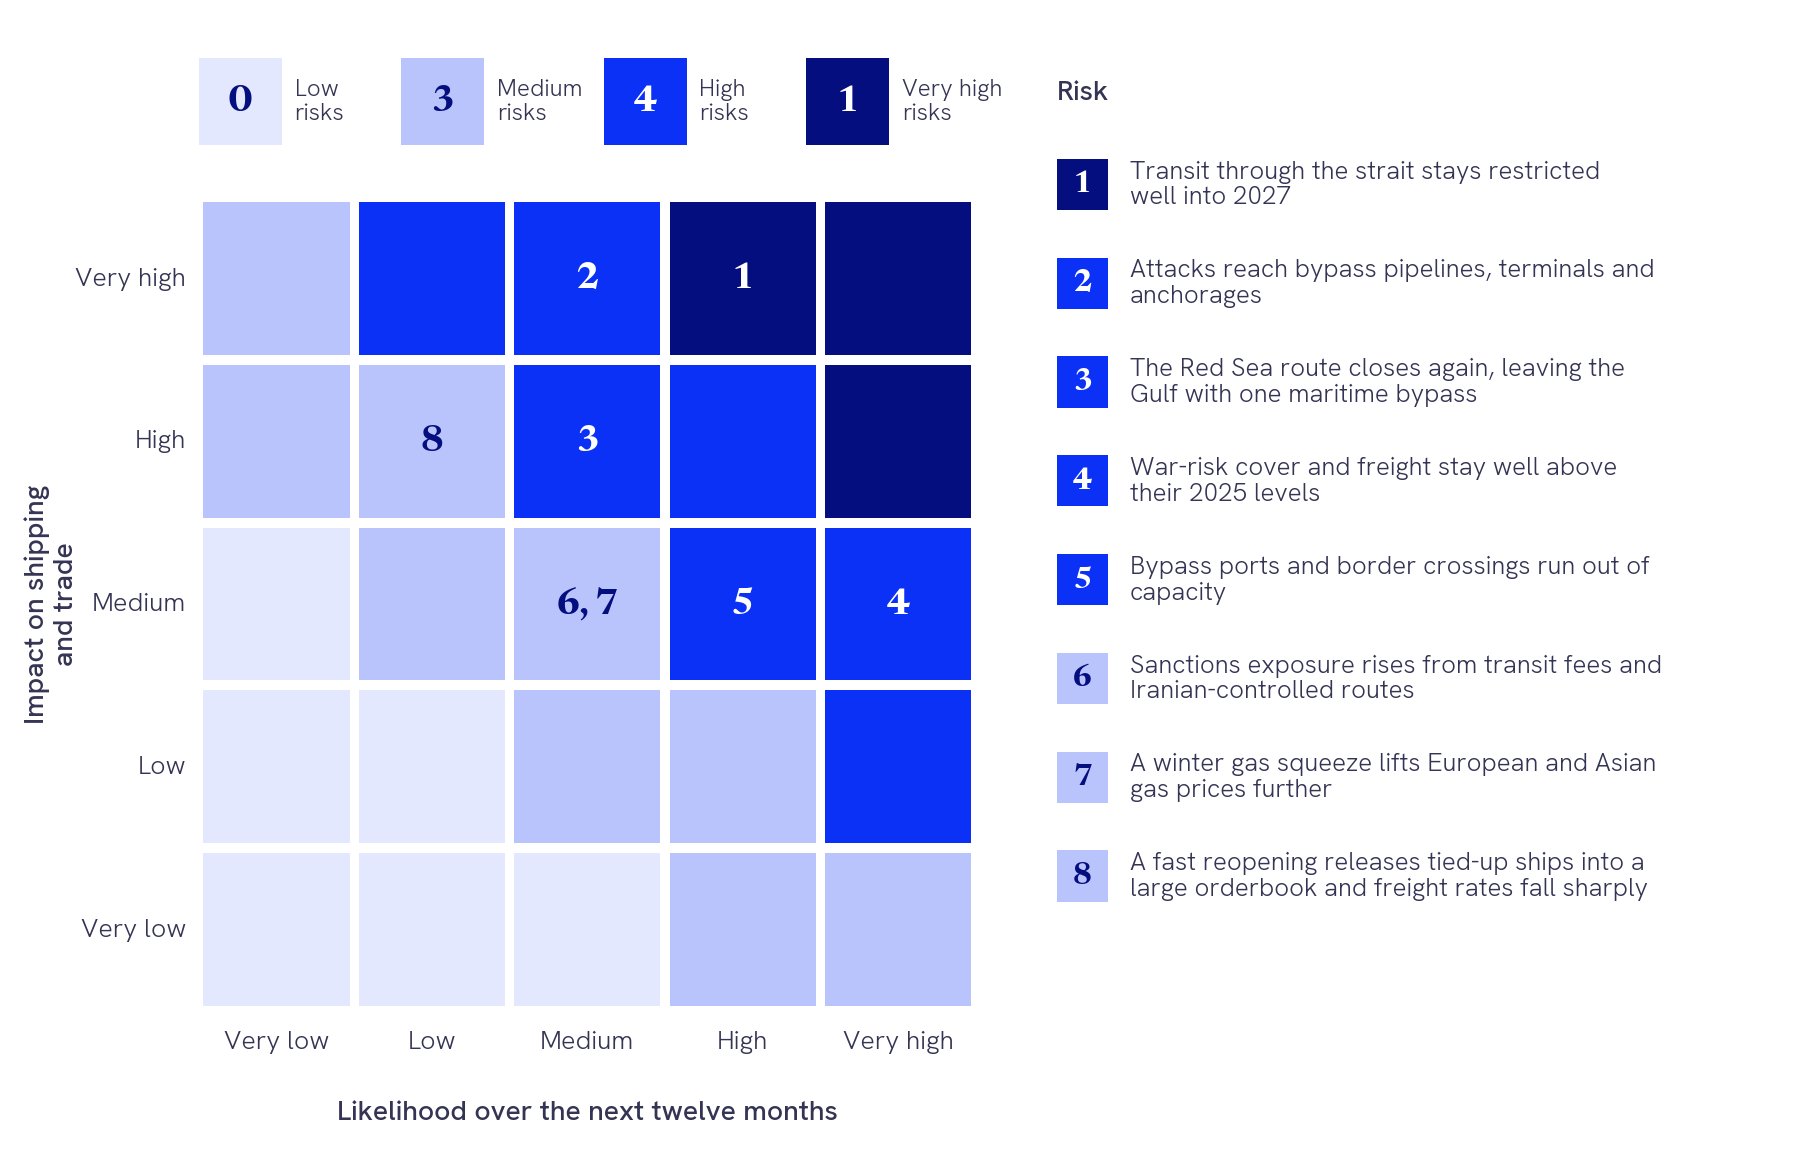
Note: Cells are shaded by severity band (likelihood plus impact). Likelihood and impact are analytical judgments based on the sources cited in this report, not measured probabilities.
Source: Reeve Hayward assessment, drawing on the US EIA, the OECD, company filings and the sources cited above
These are the indicators we will follow:
- The EIA’s third-quarter chokepoint estimates. They will show whether oil through the strait has recovered from 4.9 million barrels a day in the second quarter, and how much the Red Sea route is carrying.
- US-supported transits. US Central Command’s next count of the vessels it has supported will show whether more ships are crossing.
- Shipowners’ next results. Bookings for the fourth quarter from listed tanker and gas-carrier owners will show whether tanker earnings have peaked.
- QatarEnergy’s delivery schedule for 2027. Its schedule and new supply agreements, such as October’s with Woodside, will set out how it serves its customers next year.
- Bypass capacity. Progress on the UAE’s planned second bypass pipeline, on Hafeet Rail and on the GCC railway under the agreement of 8 November will set how much can move without the strait.
The Strait of Hormuz has not closed to trade so much as narrowed it and raised its price. Oil still leaves the Gulf, though far less of it through the strait and more of it through the Red Sea; container trade reaches the Gulf through Salalah, Sohar, Khor Fakkan and the roads behind them; and the shipowners, insurers and bunker suppliers who make those routes work are earning what the risk now commands. World trade has absorbed the shock because those workarounds exist.
The Strait of Hormuz has not closed to trade so much as narrowed it and raised its price.
For companies in Qatar and the Gulf, the practical lessons are about routes, contracts and timing:
- Price the route, not the port. A shipment’s cost now depends on how it reaches the Gulf as much as on where it is going; plans should carry the freight, insurance and haulage of the route actually used.
- Contract for more than one way in and out. The companies that kept trading in 2026 had bookings through Omani, east-coast UAE and Red Sea ports and the land links behind them, as Qatar had planned for since 2017.
- Budget at today’s costs, and plan for their fall. Tanker earnings and war-risk cover are well above their 2025 levels; when transit normalizes, a large orderbook means rates could fall quickly, which matters for anyone fixing long charters or valuing ships now.
- Hold stock of what cannot be replaced quickly. Lead times through bypass ports are longer and less predictable, and border crossings on the land routes have been congested.
- Check the compliance of every route. Transit arrangements, fees and the trading histories of the ships used carry sanctions and insurance risks that belong in contract reviews.
The same discipline belongs in strategy consulting in Qatar for companies that import, export or invest across the Gulf: a strategy that works only when the strait is fully open is a strategy with a missing chapter.
About this report
This report draws on official statistics, institutional reports, company filings and press reports read on November 5 and November 10, 2026: the US EIA, UN Comtrade, the World Bank Pink Sheet, the OECD, the IEA, the US Geological Survey, US Central Command, Mwani Qatar, the Suez Canal Authority, The Peninsula and the filings of listed shipping companies with the US Securities and Exchange Commission. Ship-tracking counts understate what moves and are described as such; prices change daily; statements about what could happen are analytical judgments, not forecasts; and the report takes no position on the regional hostilities, which it describes as a disruption of shipping. It describes markets and published data; it does not value any company or recommend any security or commodity. It is for information only and is not investment advice.
The Research team at Reeve Hayward prepared this report in Doha. To discuss the findings, contact the team at info@reevehayward.com or +974 5577 4811.
Sources
- US EIA, “Short-Term Energy Outlook: Global Energy Security Data,” August 12, 2026, Tables 2 and 4; Reeve Hayward analysis.
- International Seaways, “Third Quarter 2026 Results,” November 5, 2026; DHT Holdings, October 12, 2026 (Forms 8-K and 6-K).
- Heidmar Maritime Holdings, second-quarter 2026 results, September 1, 2026 (Form 6-K).
- World Bank, “Commodity Price Data (The Pink Sheet),” monthly prices, updated November 3, 2026; Reeve Hayward analysis.
- OECD, “Measuring Connectivity across the India-Middle East-Europe Corridor,” November 5, 2026, chapter 1.
- OECD, “Economic Outlook, Interim Report September 2026,” September 23, 2026, paragraph 3.
- US EIA, “World Oil Transit Chokepoints,” March 3, 2026.
- UN Comtrade, 2024 imports by all reporters from the seven economies, by HS code, accessed November 5, 2026; Reeve Hayward analysis. Shares are by country of origin and include Saudi and UAE exports shipped from ports outside the strait.
- US Geological Survey, “Mineral Commodity Summaries 2026,” helium, February 2026; Reeve Hayward analysis.
- US EIA, “World Oil Transit Chokepoints,” March 3, 2026, Figure 5 data; Reeve Hayward analysis.
- UN Comtrade, 2024, importers’ declarations, accessed November 5, 2026; Reeve Hayward analysis.
- IEA, “Strait of Hormuz Factsheet,” February 2026, p. 6.
- US EIA, “Short-Term Energy Outlook: Global Energy Security Data,” August 12, 2026, text and notes to Tables 2 and 4.
- US EIA, “Short-Term Energy Outlook: Global Energy Security Data,” August 12, 2026, Table 4.
- US EIA, “Short-Term Energy Outlook: Global Energy Security Data,” August 12, 2026, Table 2; Reeve Hayward analysis.
- Suez Canal Authority, chairman’s remarks, November 5, 2026.
- Frontline, “Second Quarter 2026 Results,” August 28, 2026 (Form 6-K).
- International Seaways, “Third Quarter 2026 Results,” November 5, 2026; Scorpio Tankers, “Third Quarter 2026 Results,” October 28, 2026; Dorian LPG, results for the quarter to September 30, 2026, November 5, 2026; Genco Shipping & Trading, “Third Quarter 2026 Results,” November 4, 2026; Reeve Hayward analysis.
- International Seaways, November 5, 2026; Frontline, August 28, 2026.
- Frontline, August 28, 2026; Scorpio Tankers, October 28, 2026.
- Dorian LPG, November 5, 2026; Reeve Hayward analysis.
- World Bank, “Pink Sheet,” November 3, 2026; Reeve Hayward analysis.
- US EIA, “Short-Term Energy Outlook,” October 2026.
- Capital Clean Energy Carriers, third-quarter 2026 results, October 30, 2026 (Form 6-K).
- Flex LNG, “Second Quarter 2026 Report,” August 19, 2026 (Form 6-K).
- World Bank, “Pink Sheet,” November 3, 2026.
- US EIA, “Short-Term Energy Outlook,” Global Energy Security, August 12, 2026, Table 10.
- Woodside Energy, release of October 29, 2026 (Form 6-K).
- Borouge, “Q3 2026 results,” October 29, 2026.
- OECD, “Measuring Connectivity across the India-Middle East-Europe Corridor,” November 5, 2026, chapter 1.
- Emirates Shipping Line, customer advisories of April 2 and April 22, 2026.
- Mwani Qatar, “Performance Statistics,” read November 5, 2026; Reeve Hayward analysis.
- Milaha, “Milaha Gulf Express,” schedule, October 2026.
- Sea-Intelligence, press release 403, August 19, 2026.
- US Central Command, release of October 25, 2026.
- INTERTANKO, “Advice for members regarding situation in Middle East,” updated October 30, 2026.
- Heidmar Maritime Holdings, second-quarter 2026 results, September 1, 2026 (Form 6-K).
- US Development Finance Corporation, release of April 3, 2026; Congressional Research Service, Insight IN12688, May 6, 2026.
- US EIA, “World Oil Transit Chokepoints,” March 3, 2026.
- OECD, “Measuring Connectivity across the India-Middle East-Europe Corridor,” November 5, 2026, chapter 1, note 6.
- GCC Railways Authority, as reported in The Peninsula, May 11, 2026; The Peninsula, “Qatar signs general agreement to connect GCC countries with railways,” November 8, 2026.
- OECD, “Economic Outlook, Interim Report September 2026,” September 23, 2026, paragraph 3.
- OECD, “Economic Outlook, Interim Report September 2026,” September 23, 2026, paragraphs 11 and 18.
- OECD, “Economic Outlook, Interim Report September 2026,” September 23, 2026, paragraph 18.
To discuss what this means for your business, speak with our team. Initial conversations are confidential and without obligation.
Speak with our team


